MARKET BREADTH INDICATORS & OSCILLATORS
Technical analysts do not rely upon just price and volume to gauge market sentiment since other datapoints can create a fuller picture of a trend's breadth and durability.
The number of stocks that post new highs and lows in a session and the balance between the simple number of risers and fallers can at times provide extra depth to market interpretation.
In the latter case, if the day-by-day measure of this net figure is rising then the inference is that the wider market is also rising.
Perhaps the most telling signal comes when the trajectory of gainers versus losers starts to diverge from that of the index it follows as this usually suggests the market is about to change tack.
Another variation, rather than looking at the difference, is to look at the ratio of advancing stocks over declining stocks. This line can occasionally spike, as if to signal a large imbalance in favour of risers and thus imply the market is overbought.
Forward thrust
The breadth thrust indicator looks at an average of the advances as a proportion of the whole market. Spikes in this line can flag the development of a new bull trend. A surge in the line from below 40% to above 61.5% within a ten-day period gives the thrust signal.
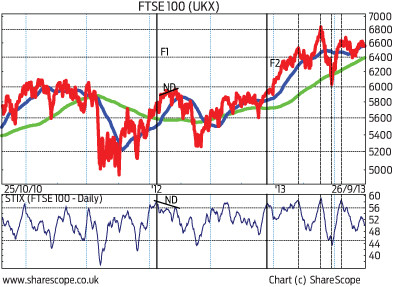
The McClellan Oscillator, the STIX and the TRIN or Arms index study are derivatives of these approaches. The Arms index divides the ratio of advances to declines by the ratio of the volume for the two groups. The line signals more buying than selling when it registers a value of less than one and more selling than buying is signalled by an indicator reading of above one. A falling TRIN line is considered bullish whilst a rising one is bearish.
When measuring the number of new highs and lows, the look-back period used is usually one year although technical traders can use any time horizon they consider to be pertinent. The difference between the numbers of new highs and lows is calculated and drawn as a line, a method that can be used for the ratio too.
In the case of the difference line the track will be above zero when the trend is up and below nought when the trend is down. Sharp drops presage a market decline and divergence between the market's benchmark index and the new highs minus new lows line is often a warning sign all is not as it seems.
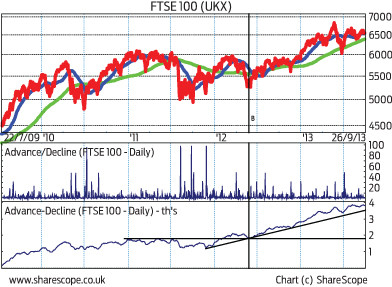
The first sub-graph shows the advance/decline ratio for the FTSE 100 and its tendency to spike near significant lows. The second sub-graph shows the cumulative risers-versus-fallers line. At ?B? the index had lost close to 12% of its value in two months but support from previous resistance held and an upward sloping trend line has subsequently dominated. A break below this line is needed to signal an end to the bull run.


