13 March 2025
Care REIT plc
("Care REIT" or "CRT" or the "Company" or, together with its subsidiaries, the "Group")
ANNUAL RESULTS FOR THE 12 MONTHS ENDED 31 DECEMBER 2024
Further improvement in rent cover and operational performance, supporting increased rent receipts and fully covered dividend payments
The Board of Directors of Care REIT plc (ticker: CRT), the real estate investment trust which gives investors exposure to a diversified portfolio of UK healthcare real estate assets, in particular care homes, presents the Company's annual results for the 12 months ended 31 December 2024.
Summary
On average, our tenants continue to improve in performance, growing fees above both labour cost and general inflation, with careful cost control and modestly increasing bed occupancy. As a result, our rent cover has increased to 2.2x1, the highest since our IPO in 2017, further enhancing the security of our rental income.
Our total rental income rose, mainly due to the 3.6% increase from annual rent reviews. This has in turn driven a 1.9% increase in adjusted EPS (EPRA EPS up 2.4%). EPRA net tangible assets per share increased by 3.7% and the total accounting return was 9.4%.
Net LTV was up marginally to 28.4% and the Company has £52 million of uncommitted debt facilities. Dividend for the year was up 2.7%, in line with our target, and 107% covered by adjusted EPS.
The Board announced on 11 March 2025 that it is recommending a cash offer at 108 pence per share for the entire issued share capital of the company ("the Offer") by CareTrust REIT, Inc. ("CareTrust"). More information on this is available in that announcement.
|
| Year ended 31 December 2024 | Year ended 31 December 2023 | Change |
| Dividends declared per share | 6.95p | 6.77p | +2.7% |
| Profit before tax | £45.0m | £48.8m | -7.9% |
| Earnings per share ("EPS") | 10.85p | 11.79p | -8.0% |
| EPRA EPS | 8.89p | 8.67p | +2.4% |
| Adjusted earnings per share2 | 7.42p | 7.28p | +1.9% |
| Adjusted earnings dividend cover | 107% | 108% | |
| Contracted annual rent roll3 | £51.4m | £48.8m | +5.3% |
| Property Investments | £679.0m | £651.3m | +4.3% |
| EPRA Net tangible assets ("EPRA NTA") per share | 119.21p | 114.96p | +3.7% |
| Net loan to value (EPRA LTV) | 28.4% | 27.8% | +57bps |
| Total accounting return | 9.4% | 10.8% | -1.4%pts |
| Cash | £10.5m | £9.4m | |
Simon Laffin, Chair, commented:
"This year has been yet another year of progress for Care REIT, with our tenants continuing to strengthen their businesses, which in turn makes our business even more secure. We own quality care homes with good operators and play an ever more important role in the health infrastructure of the UK. The country needs more care homes to cope with an ageing population and to relieve stress on the NHS that struggles to discharge elderly patients with continuing care needs.
The Board believes that our model of inflation-based rent reviews, with high rental cover, in a market where supply is very constrained and demand rising, continues to offer the basis for profitable growth. We believe that we could profitably invest more capital, both to acquire more care homes and to invest in enhancing our existing portfolio, but we remain constrained by high interest rates and the high discounts to net asset value that affect the UK REIT sector generally. This means that we cannot raise more capital to grow the business and achieve our potential."
Financial highlights
· 2.7% increase in dividend target per share 6.95p (2023: 6.77p). This was 107% covered by adjusted EPS and 128% by EPRA EPS.
· 3.6% increase in target dividend for the year to 31 December 2025 to 7.20p per share4.
· Rent reviews in the year added 3.4% to contracted rent, increasing the contracted rent roll by £1.7 million.
· 3.7% increase in EPRA NTA to £493.97 million (119.21 pence per share) and 4.3% increase in property investments, which were independently valued property by property at £679.0 million.
· 9.4% total accounting return, ahead of long-term 9.0% target4.
· Strong balance sheet with year-end EPRA (net) LTV of 28.4% (31 December 2023: 27.8%), and £250.0 million committed bank facilities of which £197.8 million was drawn. The weighted average term of debt facilities (excluding options to extend) was 5.5 years5, with 88% of our drawn debt facilities fixed or hedged against interest rate rises for the remainder of this financial year.
· The average cost of drawn debt was 4.7%. At 31 December 2024, the Group had £52.2 million of undrawn debt facilities and £10.5 million cash, against commitments of £15.7 million.
Operational highlights
· 2.2 times average annual rent cover1, (2023: 2.0 times) which was strong through the year, reflecting our tenants' success in growing their fees, cost control and further increases in occupancy.
· 100% collection of the rent due in the period with no voids. Seven of the Group's properties are on variable-rent leases after being re-tenanted in 2024 from Melrose.
· 89.1%6 underlying resident occupancy at the end of December 2024 (2023: 88.2%).
· In 2024, we significantly ramped up our asset management programme, approving £12.7 million on projects at existing homes. During the year, we invested £14.0 million, up from £4.7 million in 2023. These projects will add a net 47 beds, create new indoor and outdoor spaces for residents, and reduce energy use. At the year end, we had a pipeline of 10 further projects, with anticipated investment of £16.8 million over the next two to three years.
· During the year, we exchanged contracts to purchase an 83-bed care home near Darlington, for £3.8 million, and agreed to invest in the development of a new 72-bed home in Bedale, North Yorkshire, for a capped price of £8.7 million.
· We also continued to optimise our portfolio, to improve its overall quality and generate funds for reinvestment. In 2024, we agreed sales of five non-core assets for a total of £8.8 million, in line with their latest valuation. Two of these disposals had completed by the year end. The sales also reduced our exposure to Minster, our largest tenant.
|
| At 31 December 2024 | At 31 December 2023 | Change |
| Topped-up net initial yield | 6.96% | 6.92% | 4 bps |
| Rents containing inflation-linked uplifts | 100% | 100% | - |
| WAULT to first tenant break | 20.2 years | 20.8 years | -0.6 years |
| Portfolio let | 100% | 100% | - |
| Average annual rent cover1 | 2.2 | 2.0 | +9.4% |
| Rent Collection7 | 100% | 99% | +1.0% |
| Properties | 137 | 140 | -2.1% |
| Beds | 7,655 | 7,721 | -0.9% |
| Tenants8 | 15 | 14 | +1 |
| Assets rated EPC B or better9 | 60% | 57% | +3bps |
Developing plans to improve the social impact and environmental sustainability of our portfolio
· We continued to focus on improvements to the environmental sustainability of our portfolio with a target to achieve net zero status by 2045. We've further improved the energy efficiency of homes through asset management projects and improved energy performance certificate (EPC) ratings through energy efficiency projects. 60% of our homes have an EPC rating of B or above based on English equivalent ratings, making us well positioned to achieve 100% by the year 2030.
· The CO2 emissions from our tenant energy consumption reduced by 3%, but our 2025 target of a 15% reduction from our 2022 baseline is now looking unlikely to be met. We continued to review the best long-term strategy for investing further to improve energy efficiency, balancing environmental and commercial considerations for ourselves and our tenants. We are improving our access to underlying tenant energy performance data through regular direct data capture, enabling us to more accurately identify homes where sustainability improvements are most needed.
ANNUAL RESULTS PRESENTATION
A Company presentation for analysts and investors will take place today at 10.00am (UK) via a live webcast and conference call and Q&A.
To access the live webcast, please register in advance at:
https://brrmedia.news/CRT_FY24
The conference call dial-in is available using the below details:
| Phone numbers: | 020 3514 3188 (UK) 1-412-902-6510 (international) |
| Participant access code: | Care REIT - FY24 Results |
If you would like to ask your questions verbally, please dial into the conference call. Alternatively, you can type questions into the webcast viewer.
The replay of the presentation will also be accessible on demand later in the day on the Company's website: www.carereit.co.uk.
ANNUAL REPORT
A copy of the Annual Report is also available on the Company's website at https://www.carereit.co.uk/investors/reporting-centre/. The Annual Report has also been submitted to the National Storage Mechanism and will shortly be available at https://data.fca.org.uk/#/nsm/nationalstoragemechanism.
2025 NOTICE OF ANNUAL GENERAL MEETING
The 2025 Notice of Annual General Meeting is now available to view on the Company's website at https://www.carereit.co.uk/investors/reporting-centre/. The Company's Annual General Meeting will be held at 9:30 a.m. on Thursday, 22 May 2025, at the offices of Travers Smith LLP, 10 Snow Hill, London EC1A 2AL.
The formal Notice of the Annual General Meeting will be posted to those shareholders who have requested that the Company should continue with postal correspondence and in accordance with Listing Rule 9.6.1 has been submitted to the Financial Conduct Authority and will shortly be available for inspection from the National Storage Mechanism at https://data.fca.org.uk/#/nsm/nationalstoragemechanism.
The Board encourages Shareholders to vote on any of the matters of business at the AGM in advance by proxy.
FOR FURTHER INFORMATION, PLEASE CONTACT:
| Impact Health Partners LLP | | Via H/Advisors Maitland |
| Andrew Cowley | | |
| Mahesh Patel | | |
| David Yaldron | | |
| | | |
| | | |
| Jefferies International Limited | | 020 7029 8000 |
| Tom Yeadon | tyeadon@jefferies.com | |
| Ollie Nott | onott@jefferies.com | |
| | | |
| | | |
| Winterflood Securities Limited | | 020 3100 0000 |
| Neil Langford | neil.langford@winterflood.com | |
| Joe Winkley | joe.winkley@winterflood.com | |
| | | |
| | | |
| H/Advisors Maitland (Communications advisor) | carereit-maitland@h-advisors.global | |
| James Benjamin | | 07747 113 930 |
| Billy Moran | | 020 7379 5151 |
The Company's LEI is 213800AX3FHPMJL4IJ53.
Further information on Care REIT plc is available at www.carereit.co.uk.
NOTES:
Care REIT plc (formerly Impact Healthcare REIT plc) acquires, renovates, extends and redevelops high quality healthcare real estate assets in the UK and lets these assets on long-term full repairing and insuring leases to high-quality established healthcare operators which offer good quality care, under leases which provide the Company with attractive levels of rent cover.
The Company aims to provide shareholders with an attractive sustainable return, principally in the form of quarterly income distributions and with the potential for capital and income growth, through exposure to a diversified and resilient portfolio of UK healthcare real estate assets, in particular care homes for the elderly.
The Company's dividend policy is to seek to maintain a progressive dividend that is covered by adjusted earnings.
On this basis, the target total dividend for the year ending 31 December 2025 is 7.20 pence per share4, a 0.25 pence or 3.6% increase over the 6.95 pence in dividends paid or declared per ordinary share for the year ended 31 December 2024.
The Group's Ordinary Shares were admitted to trading on the main market of the London Stock Exchange, premium segment, on 8 February 2019. The Company is a constituent of the FTSE EPRA/NAREIT index.
Profit Forecast
The Offer referred to in the section titled "Summary" above is governed by the City Code on Takeovers and Mergers (the "Takeover Code"). In accordance with the rules of the Takeover Code, the Company is required to publish certain confirmations in connection with the information set out in this announcement. These confirmations are set out below.
The following statements in this announcement (the "CRT plc Statements") constitute ordinary course profit forecasts for the purposes of Rule 28.1(a) and Note 2(b) on Rule 28.1 of the Takeover Code:
· "The rental growth built into our leases and the return to rental payments from the former Silverline homes will also support further progression in our earnings and dividend." (Page 4 of the 2024 annual report).
· "Our model delivers predictable and rising revenue, so we can pay a progressive, fully covered dividend." (Page 3 of the 2024 annual report).
· "We aim to deliver a dividend that's fully covered by adjusted earnings. The total dividend for 2024 was 128% covered by EPRA EPS and 107% covered by adjusted EPS. Our dividend target for 2025 is 7.20 pence per share, an increase of 3.6% on 2024." (Page 39 of the 2024 annual report).
Directors' confirmation
With the consent of CareTrust REIT, inc., the Panel on Takeovers and Mergers has granted a dispensation from the Takeover Code requirement for CRT's reporting accountants and financial advisers to prepare reports in respect of the CRT plc Statements.
The CRT Directors confirm that, as at the date of this announcement, the CRT plc Statements remain valid and confirm that they have been properly compiled on the basis of assumptions stated below and that the basis of accounting used is consistent with CRT's accounting policies.
The CRT plc Statements exclude any transaction costs applicable to the Offer or any other associated accounting impacts as a direct result of the Offer.
Assumptions
The CRT plc Statements were prepared on the basis of the following assumptions, any of which could turn out to be incorrect and therefore affect the validity of the CRT plc Statements:
Factors outside the influence or control of the Company's Directors:
· No material change in the political, economic and/or market environment that would materially affect CRT.
· There will be no material changes in market conditions over the period to 31 December 2025 in relation to either tenant demand or competitive environment.
· No significant or one-off events or litigation that would have a material impact on the operating results or financial position of CRT.
· There will be no material adverse change to CRT's tenant relationships.
· No adverse changes to inflation, interest of tax rates compared with CRT's budgeted estimates.
· No material adverse events which will have a significant impact on the operating results or financial position of CRT.
· No material adverse outcome from any ongoing of future disputes with any tenants, competitor, regulator or tax authority.
· No material change in legislation, taxation, regulatory requirements, applicable standards or the position of any regulatory bodies impacting CRT's operations or accounting policies.
Factors within the influence and control of the Company's Directors:
· No additional significant acquisitions, disposals, developments, partnership or joint venture agreements being entered into by CRT which could have a materially dilutive effect on CRT's earnings.
· No material change in the dividend or capital policies.
· No material changes to the Investment Management team of CRT.
· No material changes to CRT's strategy.
· CRT's accounting policies will be consistently applied in the period ending 31 December 2025
Notes
1 Average annual rent cover is a defined term in the Glossary of the 2024 annual report.
2 Adjusted earnings per share reflects underlying cash earnings per share in the period. The adjustments made to EPS in arriving at EPRA and Adjusted EPS are set out in note 11 to the Financial Statements.
3 Contracted rent is a defined term in the Glossary of the 2024 annual report.
4 This is a target only and not a profit forecast. There can be no assurance that the target will be met and it should not be taken as an indicator of the Company's expected or actual results.
5 This assumes the extension of the NatWest facility has not been exercised, including this the weighted average term of debt facilities would be 5.7 years.
6 Excludes closed or under-development homes. Upon opening, these are excluded for up to three years while in build-up. Currently one home is excluded.
7 We've collected 100% of the rent due in respect of 2024. Seven of the Group's properties are on variable-rent leases after being re-tenanted in 2024 from Melrose.
8 Including Croftwood and Minster, which are both part of the Minster Care Group, and Melrose Holdings Limited which is an affiliate.
9 Based on published EPC data for English equivalent rating from Scottish EPCs. The English equivalent for one Scottish property has been estimated based on comparable properties. The EPCs are those currently registered for each property and may be based off historic regulation and are therefore subject to change upon re-inspection.
* EPRA EPS and all other EPRA alternative performance measures have been calculated in line with EPRA best practices recommendation.
Investing in UK care homes for everyone
2024 Annual report and financial statements
About us
Investing in care homes for everyone
Care REIT plc is the new name for Impact Healthcare REIT plc. While our name is different, our business, strategy and the needs we meet are the same.
The UK, like most Western countries, is experiencing a profound demographic change. As our population ages, an unprecedented number of people will require care in later life. While some of this care can be provided at home, demand for care beds will also rise and people entering a care home are likely to have increasingly complex needs, with either advanced frailty or some form of dementia.
However, large numbers of elderly people already have trouble accessing social care, with many thousands stuck in hospital beds because they have nowhere else to go. This leads to worse outcomes for them, more cost for the NHS and fewer hospital beds for the patients who need them. A thriving care home sector is therefore vital to the health and wellbeing of the UK.
The opportunity for us is to help meet the growing pent-up demand for well-run and affordable care homes.
As a specialist and responsible owner of care homes, we're deeply immersed in the social infrastructure of the UK. We're proud to own care homes that cater for everyone, with around 70% of our tenants' residents funded by local authorities or the NHS.
We take a long-term view and look to generate secure and growing income, so we can offer attractive and progressive dividends to our shareholders and the potential for capital growth.
Find us online:
www.carereit.co.uk
Key statistics
| | Year ended 31 December 2024 | Year ended 31 December 2023 | Change |
| Properties | 137 | 140 | (2.1)% |
| Beds | 7,655 | 7,721 | (0.9)% |
| Tenants1 | 15 | 14 | +1 |
| Portfolio valuation | £679.0m | £651.3m | +4.3% |
| Contracted rent roll2 | £51.4m | £48.8m | +5.3% |
| Weighted average unexpired lease term (WAULT) | 20.2 years | 20.8 years | (2.9)% |
| Inflation-linked leases | 100% | 100% | |
| Dividend per share for 2024 | 6.95p | 6.77p | +2.7% |
| Assets rated EPC B or better3 | 60% | 57% | +3% |
| Average home ratings on carehome.co.uk | 9.3 | 9.0 | |
1. Includes Minster and Croftwood, which are subsidiaries of Minster Care Group.
2. Contracted rent roll is defined in the glossary.
3. For assets outside England, this is based on an English-equivalent rating.
Our purpose, strategy and values
Our purpose is to work with tenants to provide quality, affordable and sustainable care homes, in order to deliver an attractive risk‑adjusted return.
This purpose determines our strategic priorities, which are to:
| Work with our tenants to form long-term, mutually beneficial partnerships, so we can grow together | Focus on quality by investing in our buildings and supporting our tenants to provide quality care to their residents | Focus on affordability by setting rents at levels our tenants can afford now and in the long term, enabling them to charge fees that are more affordable to residents
|
| Increase our sustainability by continuing to improve our portfolio's social and environmental performance | Optimise our business to provide more care home beds that are fit for our purpose | We've used these priorities to structure this report, to show how we're putting our purpose into practice.
|
Our values
Care homes are vital to both the people who live and work in them and society as a whole. We have a responsibility to make decisions that take account of all our stakeholders' needs, particularly the impact on our tenants' residents. Throughout this report, you'll see examples of our values in action, from the way we work with our tenants to support their provision of care, to our investment in our homes to keep them fit for the future.
Our core values are to:
· focus on the long-term sustainability of our business;
· act openly and transparently with our stakeholders;
· be a dependable partner who's trusted to deliver; and
· combine the strengths of a listed company with entrepreneurship.
Our Investment Manager
Impact Health Partners LLP, our Investment Manager (IM), plays a vital role in our success. Its senior team has decades of experience of owning and operating healthcare real estate, and their knowledge, skills and relationships give us an important advantage in our market.
2024 in brief
The Group grew adjusted earnings and its net assets in 2024
The Group performed well in 2024, as shown below:
| | Year ended 31 December 2024 | Year ended 31 December 2023 | Year ended 31 December 2022 | Year ended 31 December 2021 | Year ended 31 December 2020 |
| Profit before tax | £45.0m (7.95)% | £48.8m | £16.9m | £32.0m | £28.8m |
| Adjusted EPS1 | 7.42p +1.9% | 7.28p | 7.11p | 6.68p | 5.93p |
| EPRA EPS1,3 | 8.89p +2.4% | 8.67p | 8.40p | 8.05p | 7.25p |
| Property investments1 | £679.0m +4.3% | £651.3m | £568.8m | £496.9m | £418.8m |
| EPRA NTA1 per share | 119.21p +3.7% | 114.96p | 110.08p | 112.41p | 109.58p |
| EPRA (net) LTV1 | 28.42% +0.57% pts | 27.85% | 24.10% | 23.17% | 17.06% |
Our new name
In October 2024, we announced that we had changed the Company's name from Impact Healthcare REIT plc to Care REIT plc.
This complies with the Financial Conduct Authority's updated Sustainability Disclosure Rules, which limits the use of the word "impact".
Our new name better reflects that we're a real estate business that invests in care homes. Our investment policy, strategy and objectives remain the same and we are firmly focused on the significant opportunity we see in the care home sector over the coming years.
Putting our purpose into practice: delivering attractive risk-adjusted returns
The value of our property investments increased by 5.0% on a like-for-like basis, mainly due to inflation-linked rental growth, contributing to 3.7% growth in EPRA NTA per share1.
This performance enabled us to achieve our return objectives, which are:
| Objective | Performance in 2024 |
| A progressive dividend that's fully covered by adjusted EPS | We met our dividend target of 6.95 pence per share, up 2.7% (2023: 6.77 pence per share), which was 107% covered by adjusted EPS and 128% by EPRA EPS3.
|
| An average total accounting return of 9.0% per annum1,2 | Our total accounting return was 9.4% (2023: 10.8%), slightly ahead of our target. |
Our dividend target for 2025 is 7.20 pence per share2, up 3.6%.
Putting our purpose into practice: working with our tenants
We work closely with our tenants, with our long-term partnership approach reflected in the WAULT of 20.2 years at 31 December 2024 (31 December 2023: 20.8 years).
We transferred the operation of seven of our care homes to two new tenants. They replaced Melrose, an affiliate of Minster, which had stabilised the homes' performance as part of a recovery plan we announced in June 2023. As a result of these changes, we had 15 tenants4 at the year end, a net increase of one in the year.
1. For further discussion of these metrics see pages 113 to 119 of the 2024 annual report. EPRA alternative performance measures have been calculated in line with EPRA best practices recommendation.
2. This is a target only and not a profit forecast. There can be no assurance that the target will be met and it should not be taken as an indicator of the Company's expected or actual results.
3. The comparative EPRA earnings have been restated in line with updated guidance from EPRA released in 2024 revising the calculation to include cash income received on interest rate derivatives.
4. Includes Minster and Croftwood, which are subsidiaries of Minster Care Group.
Putting our purpose into practice: our focus on quality
Improving the quality of our assets
In 2024 we significantly ramped up our asset management programme, approving £12.7 million on projects at existing homes and a further £8.7 million investment in the development of a new home. During the year we invested £14.0 million, up from £4.7 million in 2023. Overall, these projects will add a net 119 beds, create new indoor and outdoor spaces for residents, and reduce energy use. At the year end, we had a further ten projects in the pipeline, with anticipated funding of £16.8 million over the next two to three years.
Our tenants continue to provide good care
While the quality of our assets is important, the quality of care our tenants provide to their residents is paramount. A great building won't compensate for poor care and great care can be delivered in many different types of building. The government has publicly raised concerns over the reliability of the Care Quality Commission (CQC), which is the regulator in England; this is evidenced by our own portfolio where some of the ratings from inspectors are now more than five years old. We are currently reviewing different ways in which we can monitor quality of care by our tenants, including website ratings and secret shopper inspections.
Putting our purpose into practice: our focus on affordability
With our leases running for up to 35 years, it's vital that our rents remain affordable to tenants in the long term. We therefore set initial rents at sustainable levels and almost all our leases set out rent increases in line with general inflation but with minimum and maximum annual increases, typically 2% and 4% respectively.
Rent cover is one of our most important key performance indicators (KPIs). The increase in the year to 2.2x (2023: 2.0x) reflects continued improvement in occupancy and in particular our tenants' ability to raise their fees in line with, or ahead of, inflation. Our tenants have continued to focus on efficiency and further reducing agency staff costs, which, along with lower inflation in utility costs, the capped increases in our rents and the increase in average weekly fees they charge, has helped them to pay for wage increases for their staff.
Rent reviews in the year added 3.4% to contracted rent, increasing the contracted rent roll by £1.7 million. We collected 100% of rent due in respect of the year.
Putting our purpose into practice: increasing our sustainability
We continued to focus on improvements to the environmental sustainability of our portfolio with a target to achieve net zero status by 2045. We've further improved the energy efficiency of homes through asset management projects and improved energy performance certificate (EPC) ratings through energy efficiency projects. 60% of our homes have an EPC rating of B or above, making us well positioned to achieve 100% by the year 2030. The CO2 emissions from our tenant energy consumption reduced by 3%, but our target of a 15% reduction from our 2022 baseline is unlikely to be met. We continue to review the best long-term strategy for investing further to improve energy efficiency, balancing environmental and commercial considerations for ourselves and our tenants.
Putting our purpose into practice: optimising our business
In 2024, rising interest rates and conditions in the equity market meant that most REITs, ourselves included, had share prices at a significant discount to net asset values.
These factors made the Group focus on using existing cash flow and disposals to fund the business rather than trying to raise new equity or borrow significantly more.
Therefore, we continued to invest modestly in the portfolio using our existing financial resources and the proceeds from selling assets. This has allowed us to grow income and bed numbers internally through asset management (see above) and to add new assets to the portfolio, while keeping our debt levels stable.
During the year, we exchanged contracts to purchase an 83-bed care home near Darlington, for £3.8 million, and agreed to invest in the development of a new 72-bed home in Bedale, North Yorkshire, for a capped price of £8.7 million.
We also continued to optimise our portfolio, to improve its overall quality and generate funds for reinvestment. In 2024, we agreed sales of five non-core assets for a total of £8.8 million, in line with their latest valuation. Two of these disposals had completed by the year end. The sales also reduced our exposure to Minster, our largest tenant.
Prudently financing the business
We continued to maintain our existing debt financing to support our investments and increase returns, ensuring that we have kept a strong balance sheet. At the year end our gross loan to value (LTV) of 28.3% was well within the maximum in our policy of 35%. We had committed bank facilities of £250 million and significant liquidity available, with £52.2 million of undrawn facilities and £10.5 million of cash, against commitments of £15.7 million.
A successful continuation vote
In common with other investment trusts, the Company doesn't have a fixed life. Instead, shareholders have the opportunity to vote from time to time on whether it should carry on or be wound up. Our first continuation vote took place at the Annual General Meeting (AGM) in May 2024. We were delighted to receive 100% of votes in favour of this resolution and thank shareholders for their support.
Outlook
We remain well positioned to continue to deliver long-term sustainable returns to shareholders. The key themes influencing our market - an ageing population, the growing demand for higher-acuity care and the affordability of social care - play to our strengths and will offer opportunities for us for many years to come. However at present the difficulty we have in raising new capital with high market interest rates and a share price well below net asset value constrains our ability to deliver on these opportunities.
In the year ahead, we'll continue to actively manage our portfolio and dispose of non-core assets. We'll also consider selling homes where we've completed our asset management plan, so we can recycle the capital into other high-return opportunities. The rental growth built into our leases and the return to rental payments from the former Silverline homes will also support further progression in our earnings and dividend.
As announced on 11 March 2025, the Company's directors have reached agreement on the terms of a recommended cash acquisition of the ordinary share capital of the Company (the "Acquisition"). The background to and reasons for the directors' recommendation for the Acquisition is set out in the announcement made on 11 March 2025. If the Acquisition is completed, this will result in a change of control of the Company.
The growing demand for care beds for the elderly
Real estate opportunities are often underpinned by powerful structural trends.
We've seen this in the last decade, with the growth in e-commerce, digitisation and student numbers fuelling huge demand for logistics assets, data centres and student accommodation. An ageing society underpins the demand, and therefore investment rationale, in our segment of healthcare.
| Last decade | Structural trend | Real estate opportunity |
| | E-commerce | Industrial/Logistics |
| | Digitisation | Data centres |
| | Education
| Student accommodation |
| Next decade | Ageing societies | Healthcare
|


We believe that the challenge of caring for an ageing society is the next structural trend, with the potential to create attractive returns for care home owners who choose the right assets and partner with the right operators.
Within this trend we see three main themes: ageing, acuity and affordability.
Ageing
A growth market created by an ageing population
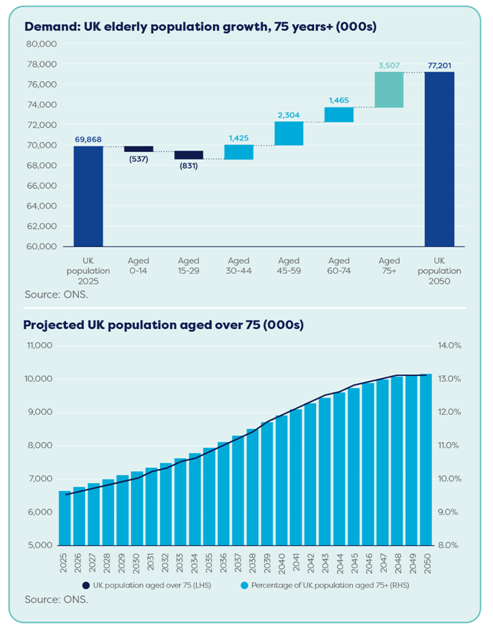
The UK will be home to an unprecedented number of older people in the coming decades. There are currently 6.5 million people aged over 75 in the UK and that number is forecast to increase by 55%, to 10.1 million, over the next 25 years. This change will happen during the lifetime of most of our leases.
Rising numbers of older people will directly lead to more demand for care home beds. However, the market has not responded by increasing supply. In fact, between 2012 and 2021, the supply of beds in nursing and residential care homes fell from 11.3 per 100 people aged over 75 to 9.4 - a 17% decrease. This reflects the high cost of developing new homes (see Affordability below), coupled with inefficient smaller operators leaving the market.
Acuity
An ageing population means care needs are becoming more complex
While rising life expectancies are good news, the downside is that most people will spend the last 15 years of their life with some ill health1. Around 10% of people over 80 have care needs that make it difficult for them to live at home.
Dementia is the most common acute condition affecting people in care homes. Around 70% of care home residents suffer from some form of memory loss, which ranges from mild confusion to severe dementia. The Alzheimer's Society projects that the number of people in the UK with some form of dementia will rise from just over 1.1 million in 2025 to 1.6 million in 2040, with the greatest rise being among people with a severe form of the condition. Dementia and Alzheimer's disease is already the leading cause of death in England and Wales, accounting for 11.4% of deaths in 2022 (source: ONS).
Since the COVID-19 pandemic, our tenants have reported that people are moving into care homes later than before, that they're more likely to be frail or ill and that their stays are shorter. This is creating a longer‑term shift in the industry, with increasing demand for care providers who can deliver higher‑acuity care.
However, many people are kept longer in hospital due to the shortage of care home beds and their inability to pay for residential or home care. This means they're in the wrong setting for the care they need, particularly if they have dementia. On average during 2023 there were just over 12,000 people2 in hospital every night who had no clinical reason to be there but could not be safely discharged. Half of those people, nearly all of them elderly, had been waiting more than 21 days to be discharged. This "bed blocking" increases costs for the NHS and has a knock-on effect on other patients, who can't be admitted to hospital without a vacant bed. The government has made reducing NHS waiting lists one of its main political aims. Achieving this will require adequate capacity in properly funded care homes.
1. Source: ONS: Healthy life expectancy in England and Wales: between 2011 to 2013 and 2021 to 2023.
2. https://www.cqc.org.uk/publications/major-report/state-care/2022-2023/access-to-care#waits


Affordability
The solution to rising demand must be affordable for care funders
Most care home residents in England are state-funded, with this source of funding being particularly important for people living in the Midlands and the North.
However, there is no national government budget for adult social care in England and a person's care needs might be met by their local authority's social services budget or by their local NHS Trust. The individual or their relatives may also have to contribute to the cost. Most local authorities support their adult social care costs through a council tax levy and, in certain situations, local authority or NHS funding is means tested.
This complexity and the pressure on public sector finances mean waiting lists for social care have grown in recent years, with a doubling of the number of people waiting for over six months. While waiting lists for NHS care are well known, the waiting lists for social care are much less publicised.


With local authority budgets likely to remain hugely constrained and demand continuing to rise, the affordability of care home places will be crucial. The economics of our sector mean that existing homes are more likely to meet this affordability test than new developments. An existing home providing good care can cost less than £100,000 per bed. In contrast, a high-quality new care home is often £200,000 or more per bed, reflecting high construction costs and limited land supply. The higher build costs of new homes lead to higher rents for tenants - up to 20%1 of their revenues as opposed to our average of 12.5% - which they have to pass on through higher fees for residents.
This restricts the size and growth of this segment of the market and means that higher fees don't automatically translate into better care, which depends more on the quality and stability of the staff than the building.
From an investment perspective, an existing home generally offers us better risk-adjusted returns. We can buy a home at less than its replacement cost and invest in it to add more beds, allow the tenant to offer more services such as dementia care, and improve its facilities and environmental performance. A bed in a well-run existing home is likely to be in high demand, generating a long-term and steadily growing income stream, which supports its capital value.
A highly fragmented market creates long‑term opportunity for us
There are currently just over 10,7002 registered care homes in the UK. The market is unusually fragmented and over the past 15 years that fragmentation has increased, as the market share of the top ten care providers has declined from a peak of 27% in 2006 to 19% in 2024. The market share of sole traders operating one or two care homes has also declined, from over 80% in the early 1990s to under 30% today. Mid-sized care providers, operating between three and 80 homes, have grown to fill this gap. Developing partnerships with operators in this space has allowed us to acquire good-quality assets at attractive yields, with the confidence that our tenants will run them well.
We currently own 1.7%2 of the market, which means we have substantial scope for long‑term growth when economic conditions allow. We will continue to generate growth internally, by adding beds to our existing homes, and when opportunities arise acquire more assets; to help meet the need for good‑quality, affordable care homes.
1. Illustrative numbers of "Typical Care Home Financials" published by a developer selling new care homes.
2. Source: LaingBuisson.
Delivering attractive risk-adjusted returns
Our business model
What we do
Select tenants
We have a diversified portfolio of tenants that includes national, regional and local businesses. When selecting a new tenant we consider:
· their track record and financial performance;
· the strength of their business plan;
· their ability to provide high-quality care to residents; and
· their ability to deliver strong trading returns over the longer term, which will support our investment.
Identify and appraise assets
We often identify assets we'd like to acquire and engage with existing and new tenants to evaluate operational performance, the affordable rent and their interest in becoming the operator. On other occasions, a tenant will bring an asset acquisition opportunity to us. When considering a transaction, we check every aspect of the homes, including reviewing their local market and the building's environmental sustainability. Our disciplined approach means we can buy at attractive prices, which are often less than the cost of replacing the asset.
Agree leases
Our leases are typically for 25 years or more and balance rental growth with ensuring rent remains affordable to tenants. The leases require tenants to spend a minimum amount every year on repairs and maintenance, and all our leases since 2020 include "green" clauses, to help us work with tenants on our ESG objectives.
Monitor tenants' performance
We keep a careful watch on many aspects of our tenants' performance, including their financial results and the quality of their care, which we discuss with our tenants on a quarterly basis.
Work with tenants to improve our assets
We agree plans with our tenants to upgrade and extend our homes. This makes them better places to live and work, increases their capacity, improves their sustainability and can broaden their offer. We can also work with tenants to develop new homes in areas with strong demand. These activities increase our rent, the value of our homes and our tenants' revenues.
Optimise the portfolio
We regularly review our assets and categorise them as core, value-add or non‑core. Value-add assets are candidates for asset management. We may sell non‑core assets, so we can reinvest the proceeds and create more value, while improving overall portfolio quality.
Manage risk
We consider risk from many angles, from ensuring our balance sheet stays strong, to the way we pick tenants and make sure they're performing well, to our focus on sustainability improvements to the resilience of our portfolio through asset management.
Our competitive advantages
Our competitive advantages come from:
· our strategic focus on mid-market care homes, which we can acquire at below replacement cost with rents at affordable rates;
· the IM's deep sector knowledge and understanding of how care businesses work, which helps with everything from buying the right assets to forming and maintaining supportive tenant partnerships;
· the IM's relationships with care home owners, the agents they work with and with potential new tenants. Great relationships and a proven track record can help us to buy assets off‑market or beat the competition even when we're not the highest bidder. These relationships also help us when targeting disposals across the portfolio; and
· the IM's asset management and development skills. We can identify how to improve a care home before we buy it, successfully complete each project and improve returns by developing new homes.
The value we create
Our high-quality business generates attractive and sustainable value for our stakeholders.
| Tenants Tenants can grow their business alongside ours, in a long-term relationship with affordable rents, which benefits both of us.
| Shareholders Our model delivers predictable and rising revenue, so we can pay a progressive, fully covered dividend. There is also the potential for capital growth, which supports an attractive total return.
Careful cost control enables us to benefit from economies of scale as we grow. Many of our costs are fixed and some variable costs will step down as our asset value rises (including the IM fee which reduces from 1.0% to 0.7% of NAV above £500 million). Along with our conservative approach to debt finance, this helps to maximise the total return we can deliver to shareholders. |
| Residents and their carers As a landlord we support both residents and their carers through our willingness to invest in their homes, to improve the spaces they live and work in.
| |
| Lenders Our lenders can provide long-term finance to us on attractive terms, knowing we have a secure and resilient business, with strong cash flows. |
How we manage risk
Delivering attractive risk-adjusted returns requires us to build risk management into everything we do. The process starts with the board, which reviews and sets our appetite for different risks each year. While our appetite for particular risks might vary over time, in general we maintain a balanced overall level of risk, which is appropriate for achieving our purpose.
The diagram on page 11 of the 2024 annual report shows our principal risks and uncertainties, in order of the risk that remains after we've taken account of the mitigations we've put in place (known as the residual risk). As the diagram shows, two of our risks are outside our risk tolerance and we're looking to mitigate them further.
· For significant tenant default, we want no more than 25% of our contracted rent to come from a single tenant. The Minster Group and its affiliates are currently 32% of our contracted rent (31 December 2023: 37%), with the reduction in 2024 resulting from adding two tenants and selling assets Minster manages. We'll continue to diversify our income over time.
· For underinvestment in care homes, the board and the IM are working to understand what the care home of the future will look like, to focus on value‑enhancing opportunities and improvements to the environment for both tenants' residents and their staff alongside the cost and delivery plan for achieving our net zero carbon target by 2045. We're looking at whether we can do this by investing in the homes in return for higher rents, whether our tenants could fund the work through increased fees for residents or if it might have to be a landlord cost.
Putting our purpose into practice
1 | Working with our tenants
| | Year ended | Year ended | |
| | 31 December | 31 December | |
| | 2024 | 2023 | Change |
| WAULT | 20.2 years | 20.8 years | (2.9)% |
| Bed occupancy | 89.1% | 88.2% | +0.9% |
We don't manage or operate our care homes, so we partner with tenants who'll operate them well and who share our focus on providing high-quality, and increasingly higher-acuity, care.
We keep in close contact with our tenants throughout the year and they provide us with detailed reports, so we can monitor their performance.
The business model describes how we choose our tenants. We also have important choices to make as we grow our portfolio, including the right balance between adding tenants and growing with existing tenants.
Our strategy: adding tenants and growing with them
When we buy assets, we can select a new tenant to run them and reduce our reliance on our existing tenants. Alternatively, we can increase the number of homes an existing tenant operates, strengthening their business and supporting our long-term partnership.
We're expanding our relationship with Prestige Group, through the transactions described on page 15 of the 2024 annual report. We've also reduced our reliance on Minster through the asset disposals discussed on page 14 of the 2024 annual report and by transferring the operations of the ex-Silverline homes from Melrose, an affiliate of Minster, to two new tenants, We Care and Fulcrum Care. See the key board decision on page 14 of the 2024 annual report for more information.
How we measure our progress
The portfolio's weighted average unexpired lease term (WAULT) is a KPI for us.
| | Year ended | Year ended |
| | 31 December | 31 December |
| | 2024 | 2023 |
| WAULT | 20.2 years | 20.8 years |
The WAULT decreased by 0.6 years, with the passage of time offsetting the benefits of new leases and lease extensions following our asset management projects.
Our shortest care home leases are currently 12.3 years and we are actively exploring ways to increase these as part of our asset management activities.
At the year end, our tenant base was as follows:
| | Contracted | | |
| Tenant | rent (%) | Properties | Beds |
| Minster Care1 | 20% | 28 | 1,631 |
| Welford | 20% | 17 | 1,102 |
| Holmes Care Group | 14% | 21 | 1,129 |
| Croftwood Care1 | 12% | 28 | 1,158 |
| Prestige Group | 7% | 5 | 469 |
| Maria Mallaband and Countrywide Group | 5% | 7 | 508 |
| Careport | 5% | 9 | 443 |
| Electus Care | 4% | 5 | 340 |
| Belmont Healthcare | 3% | 2 | 168 |
| Carlton Hall | 2% | 22 | 86 |
| Renaissance Care | 2% | 2 | 128 |
| Optima | 2% | 2 | 99 |
| Fulcrum Care | 2% | 4 | 212 |
| We Care | 1% | 3 | 182 |
| NCUH NHS Trust | 1% | 2 | n/a3 |
| | 100% | 137 | 7,655 |
1. Minster and Croftwood are both part of the Minster Care Group.
2. Carlton Hall includes a development site with planning permission for 72 beds. This is included in "homes" but excluded from "beds" until completed.
3. Assets leased to the NHS are not care homes but other healthcare facilities, hence bed numbers are not applicable.
Our strategy: choosing long-term tenant relationships
The length of new leases is an important decision for us. We favour leases of 25 years or more, since this generates long-term and growing income for our shareholders, encourages tenants to take a partnership approach, and gives residents and care home staff a stable environment to live and work in. Leases of this length also require us to be very selective when signing new tenants.
During the year, we agreed nine new leases: two with Prestige Group, four with Fulcrum Care, all of which will run for 35 years, and three with We Care which also include landlord and tenant options to increase the term to 35 years.
Monitoring our tenants' performance
The IM engages with tenants on a weekly and monthly basis and in more depth each quarter, when it receives detailed reports from tenants setting out their financial and operating performance. We also run an annual tenant survey to get their feedback.
The main factors affecting our tenants' financial performance and their ability to pay our rents are their occupancy, fees for residents, staff costs (including agency staff use) and utility costs. Trends in occupancy and fees remained positive in 2024 and in aggregate our tenants improved their financial performance and rent cover.
Staff costs have stabilised as a percentage of tenant income, with our tenants generally able to recruit more permanent employees and reduce their use of expensive agency staff, resulting in stable staffing levels overall. Staff costs will rise further from April 2025 because of the increase in the minimum wage and higher employer's National Insurance. However, our tenants are in good shape and have a track record of growing fees in line with or ahead of inflation, so we're confident they can manage these cost increases. Utility costs have improved after substantial increases in previous years and our tenants have continued to focus in 2024 on their operational efficiency.
Section 172: business relationships
The directors must consider the Group's business relationships, including with our tenants. In addition to receiving regular updates and detailed reports from the IM on each of our tenants, the directors all took part in calls with tenants during the year, without the IM being present. This allowed them to hear first-hand what tenants think of the Company as a landlord and their relationship with the IM, and to discuss how their business is going and the issues they're facing. The directors shared file notes on each call and discussed the feedback at their November board meeting.
Tenant feedback continued to be positive and while some would like us to be able to acquire more assets and help them to grow more quickly, they were very complimentary about their relationship with the IM and the support they receive.
Key board decision - approving the transfer of operations to new tenants
Our 2023 annual report included an extensive explanation of our decision to replace Silverline Group as the tenant for seven of our homes. Melrose, an affiliate of Minster, temporarily stepped in as the tenant to stabilise the homes' performance and work with us to develop a long-term strategy for them.
During 2024, we were pleased to announce that We Care had taken on the operation of the three care homes in Bradford, and Fulcrum Care was the new tenant for the four homes in Scotland. The board carefully considered whether to approve the transfers and looked at the alternatives, such as selling the homes.
The directors discussed the risks of transferring underperforming homes to new tenants, the operators' experience of turning homes around and the commercial terms, including lease incentives and working capital facilities, the Company was offering to support the new tenants. The directors considered the interests of the relevant stakeholders, including the potential impact on residents and staff, and concluded that the transfers were in the best interests of all stakeholders.
Case study
Growing with our tenants
| | Year ended | |
| | 31 December |
|
| | 2024 | Change |
| Number of additional beds | 155 | +33% |
| Anticipated yield on cost | 8% | |
Extending our partnership with Prestige Group
During the fourth quarter of 2024, we invested in two value-add opportunities in the North of England, partnering with one of our existing tenants, Prestige Group.
The first opportunity was to acquire Middleton Manor, an 83-bed purpose-built nursing home which Prestige owned and operated. We're leasing the asset back to Prestige, which is repositioning it to provide much‑needed higher-acuity care for residents requiring both dementia and nursing care. This transaction, which exchanged in 2024 and is awaiting CQC re‑registration before it completes, reflects our strategic focus on homes which provide higher-acuity care in communities with significant unmet demand, as is prevalent in the North of England, and which we can acquire below replacement cost.
The second opportunity was to forward fund the development of Bedale, a 72-bed care home. It is pre‑let to Prestige and will be developed by Prestige's sister development company, which completed the successful Merlin Manor scheme in 2022. The Prestige Group has significant experience of developing and launching care homes in the North of England and makes a strong partner for us on the Bedale investment. The home will be built to the latest specifications for both care and real estate. The design is mindful of energy efficiency, with the home being fully electric, and it is expected to achieve an EPC A rating on completion.
Structuring investments to control risk and capture increased value
In structuring the transactions, the IM focused on mitigating the risks while ensuring we can benefit from uplifts in value. For Middleton Manor, we'll pay £3.8 million upfront, with a £2.1 million deferred payment depending on the success of the repositioning and resulting improvement in the home's profitability. This will also trigger an increase in the rent we receive. This structure is very similar to a previous investment with Prestige, Yew Tree.
The forward funding of Bedale is expected to generate a highly attractive net yield on cost of over 8%. We've mitigated the risk posed by new developments by capping the price here at £8.7 million, with the developer required to cover any unexpected costs.
Creating a win-win-win investment through investment in strategic partnerships
Partnering with existing tenants benefits us, our tenants and society. Supporting the growth of good regional and national care operators such as Prestige diversifies our rental stream, giving our investors greater income security. It also reduces risk for us, since our existing relationship and ability to structure the investment based on previous successful transactions gives us confidence in Prestige's ability to deliver on the business plans. Finally, and most importantly, these partnerships add to the UK's essential social infrastructure, creating new beds in local communities and enabling care for some of the country's most vulnerable people.
Putting our purpose into practice
2 | Our focus on quality
| | Year ended | Year ended |
| | 31 December | 31 December |
| | 2024 | 2023 |
| Capex invested in improving homes for residents and staff | £14.0m | £4.7m |
Quality has two main aspects: care and buildings.
Both determine how full the homes are, how much our tenants can charge and how secure our income is. However, the quality of care is paramount for both us and our tenants. Without this, the homes cannot succeed.
Our strategic choices include how much capital we should allocate to asset management, what sort of improvements we should target, and the extent to which we should fund new developments.
Our tenants are responsible for repairing and maintaining the buildings and for their quality of care. We monitor both of these and discuss them with our tenants at least once per quarter.
Our strategy: increasing quality by investing in our assets
Our returns on asset management are higher than on most asset acquisitions. The lease terms typically allow us to rentalise the investment at 8%, with the potential for valuation uplift on the capital invested, giving a rate of return above the yield alone. These projects are also generally lower risk, since we and the tenant have a good understanding of the home and how the project will improve its performance.
However, we have to carefully consider how much to invest each year, since we also want to continue to grow the portfolio within our leverage limits and need to retain enough capital to buy assets. Our tenants also have to balance a project's longer-term benefits with the short-term disruption to the home, which can reduce their income while work is under way. We therefore need our tenant's permission for a project to go ahead.
Our portfolio management process identifies homes with the potential to add value through asset management. We then target projects that:
· improve the home for residents and staff, such as adding en-suite bedrooms and upgrading kitchens, laundries and other facilities;
· improve the environmental performance of the home and future-proof it against obsolescence; and
· expand the services our tenants can offer, such as adding specialist beds for dementia care.
Our progress in 2024
During 2024, we approved £12.7 million of new asset management projects, of which £6.7 million was spent in the year and £6 million remains outstanding. These projects are adding beds, improving the living and working environment and enhancing the homes' energy efficiency. In total, our approved projects will increase bed numbers by 47 and add £1 million to contracted rent.
Our largest current projects are shown in the table below. The case studies below give more insight on the projects at Wombwell Hall and Yew Tree:
Our pipeline currently has a further ten projects at various stages, with total funding of up to £16.8 million over the next two to three years. These projects have the potential to add 85 beds and £1.3 million of annual rent. We'll support them if they improve the quality of care and the building, create value for shareholders and we have the financial resources to deploy.
|
| Amount |
|
| Home and tenant | committed | Project benefits |
| Wombwell Hall Belmont | £2.5m | Reconfiguration of 30-bed unit into 22 beds, all with wet rooms. Refurbishment of main entrance and office into "hub" with café, seating and hair salon. Upgrade to mechanical and electrical installations and window replacement. |
| Kingston Court Careport | £1.0m | Internal reconfiguration to create four additional bedrooms and a dementia-orientated wing, with café. Installation of solar PV. |
| Turnpike Court Croftwood | £1.1m | Extension to create eight additional bedrooms and new residents' lounge. Installation of solar PV on the roof. Improved EPC (C to B). |
| Elm House Croftwood | £3.0m | Extension and internal reconfiguration to form 21 new beds (a net increase of 19), new day spaces, entrance lobby and reception, and sensory garden. Improved EPC (C to B). |
| Amberley Minster | £2.5m | Demolition of existing wing and replacement with 21 new‑build rooms (net increase of seven). Electric heating to new wing with air source heat pump. Improved EPC (C to B). |
| Yew Tree Prestige | £2.5m | New-build 25-bed unit alongside existing 76-bed Yew Tree Care Centre. All new rooms have wet rooms and are fully electric with air source heat pumps and solar PV. The unit is targeting an EPC A rating. |
| Leycester House Croftwood | £1.2m | Infill extension and internal reconfiguration to create additional wet room bedrooms and improved lounge and dining space, resulting in a net increase of five bedrooms. Improved EPC (C to B). |
Yew Tree Grange case study
Yew Tree Grange is a purpose-built care home comprising 25 bedrooms located alongside the existing Yew Tree Care Centre in Redcar, Teesside. Our tenant, Prestige, developed the building to provide premium rooms to complement the existing 76-bedroom nursing home. Yew Tree Grange is self‑contained and includes residents' lounges and dining areas, with all bedrooms benefiting from generously sized en-suite wet rooms. Care REIT invested £2.5 million in the project with a return in excess of 8%.
The building has been constructed to high environmental standards with an EPC A rating. Heating and hot water is provided from air source heat pumps and solar panels, meaning there is no need for a traditional gas-fired boiler.
Wombwell Hall case study
The first phase of work at Wombwell Hall in Gravesend, Kent was completed in November 2024. This comprised the reconfiguration of an existing 30-bed unit into 22 bedrooms with full en‑suite wet room provision and new dining and lounge areas for residents. A central reception and administration building has been converted into a "hub" with café area, salon and meeting place for residents and families. A comprehensive upgrade of the mechanical and electrical systems has also been completed, future-proofing the home for years to come. Care REIT invested £2.5 million with a return of 8.12% on the works, which form part of a longer-term strategy to reposition the home as a centre for dementia care alongside its core nursing provision. The works have resulted in an improved EPC B rating through additional insulation and new high-performance windows and external doors.
Quote from Wombwell Hall home manager: "The newly refurbished unit is an inspiring example of how we can reimagine care for those living with dementia. We've created a space that not only offers security but also enhances the quality of life of our residents."
Ensuring our tenants maintain our buildings
Regular repairs and maintenance protect the value of our homes and keep them up to standard for residents and staff.
Our leases specify the minimum amount our tenants need to spend, which totalled nearly £14 million in 2024. We monitor this carefully, looking at spend in the current year and the total over the last three years. The IM regularly visits homes to inspect them and check progress, with 124 visits taking place in 2024. Our valuer, surveyors, environmental specialists and other advisers support the IM in reviewing the quality of our buildings, with the valuers alone undertaking 46 home inspections in the year as part of their commitment to visit each property at least every three years.
Where we identify concerns, we engage with the tenant to resolve them. This may be because the tenant has fallen behind on the repairs and maintenance required by the lease terms or because we have a more general concern that the home isn't being maintained to the standards we expect.
Monitoring the quality of care
The main ways we look after residents' interests are through our oversight of care quality ratings and ensuring the homes are well maintained, as described above. Our tenants are responsible for their residents and we don't directly engage with them, except when we meet them during home visits.
The IM tracks reports and ratings from regulators, and regularly reviews customer feedback on the homes. If the regulator rates a home as inadequate or requires improvement, the IM reviews the report in detail and discusses the findings with the tenant's operations director. This allows us to understand the issues, the actions the tenant is taking and whether there are any broader operational concerns the tenant is looking to address. In addition to this the IM visits the home and meets with the home manager to better understand the issues on the ground. Where appropriate, we'll seek independent support to help resolve any ongoing issues.
How we measure our portfolio quality
The following KPIs reflect the overall quality of our assets. Our total accounting return, the WAULT and our 0% vacancy rate are also important measures of quality:
| | Year ended | Year ended |
| | 31 December | 31 December |
| | 2024 | 2023 |
| EPRA topped-up net initial yield (NIY)
EPRA topped-up NIY had a marginal movement of 4bps across the year, reflecting stable market conditions. | 6.96% | 6.92% |
| Occupancy
Occupancy across the portfolio continued to increase during the year as it recovered to pre‑COVID levels (see the chart below). This reflects both the continued attractiveness of our homes and the essential nature of the service our tenants provide. | 89.1% | 88.2% |

The CQC (the regulator for England) carried out inspections for only 10% of the portfolio of homes in England.
In contrast, the Care Inspectorate (Scotland's care regulator) continued to carry out their regular inspections, with almost 75% of the portfolio's Scottish homes being inspected during 2024.
The government has announced its intention to improve the effectiveness and efficiency of key patient safety organisations, particularly the CQC. The new chief executive of the CQC has acknowledged that the public can no longer rely on the safety ratings of care homes in England: "Effectively, the CQC is not delivering on its operational performance." With the average age of CQC assessments currently around four years1, we will be closely monitoring how this progresses. In the meantime, we're considering other indicators we can use to monitor care quality, such as ratings and reviews from residents and their families on carehome.co.uk. While online ratings are imperfect, they are regularly updated and may give us early visibility of trends in performance.
1. Source: Health and Social Care Committee on 15 January 2025, UK Parliament.
Average home ratings on carehome.co.uk
9.3 average score for our operators by home on carehome.co.uk
Above the national average of 9.0
We monitor ratings closely for individual homes and our tenants, reporting results to the board on a quarterly basis.
Section 172: community impact and business reputation
In addition to the financial implications of building and care quality discussed above, the directors must consider how these issues can affect the community and the Group's reputation. Poor buildings or care have a direct impact on residents' quality of life and the working environment for staff, and therefore the community within which they operate. Badly maintained buildings and poor care could do significant damage to tenants' reputations, which in turn could harm perceptions of the Group.
Asset management timeline
| January | April | May | September | October |
| Handover of refurbished bedrooms at Fairview House.
Spend (in year) £0.1m | Works commence on reconfiguration of Copperfield unit at Wombwell Hall.
Spend (in year) £2.5m
| Works commence on new eight‑bedroom extension at Turnpike Court and roof-mounted solar panels.
Spend (in year) £1.1m
Additional bedrooms 8 | +15.1%
| Works complete at Karam Court to create four new bedrooms and new reception area.
Spend (in year) £0.2m
Additional bedrooms 4 | +8.5%
| Handover of Copperfield unit at Wombwell Hall. |
| March | April | July | July | December |
| Works commence on refurbishment and four additional bedrooms at Kingston Court.
Spend (in year) £1.0m
Additional bedrooms 4 | +5.3%
| Work commences at Leycester House to form an additional five bedrooms and enhance the lounge and dining space.
Spend (in year) £1.1m
Additional bedrooms 5 | +12.5%
| Handover of new-build 25-bed unit at Yew Tree Care Centre. EPC A rated with air source heat pump and solar panels.
Spend (in year) £2.5m
Additional bedrooms 25 | +32.9%
| Work commences on extension at Birchlands to form four additional bedrooms, reception area and manager's office.
Spend (in year) £0.9m
Additional bedrooms 4 | +7.4%
| Work commences on eight‑bedroom extension and new dining area at Duncote Hall.
Additional bedrooms 8 | +20.0%
|
Putting our purpose into practice
3 | Our focus on affordability
| | Year ended | Year ended | |
| | 31 December | 31 December | |
| | 2024 | 2023 | Change |
| Rent cover | 2.2x | 2.0x | +9.4% |
For our business to be sustainable, our tenants must be able to attract a sufficient number of residents at appropriate fee rates, both private and publicly funded. Additionally, the rent we charge our tenants has to be affordable over the long term.
Our strategic choices relate to the rents we set when we first agree leases and how we structure our rent review clauses.
Strategy: setting initial rents and ensuring sustainable rental growth
We believe that all our stakeholders will be better off in the long run if we make sure rents remain affordable. With this in mind we typically set initial rents to ensure strong rent cover from day one, and all our leases include annual inflation-linked rental growth, with minimum and maximum increases each year. For most leases, these are set at 2% and 4% respectively.
This structure shares risk between us and our tenants. It guarantees that our income will grow every year, including when inflation is low, while protecting our tenants when inflation is high.
Care REIT leases inflation linkage
| Percentage of Care REIT leases with RPI linkage | 99% |
| Percentage of Care REIT leases with CPI linkage | 1% |
Care REIT leases caps and collars
| Percentage with floor 2%/cap 4% | 84% |
| Percentage with floor 1%/cap 5% | 15% |
| Percentage with upwards-only inflation linkage | 1% |
Section 172: long-term impact and business reputation
The way we set initial rents and structure rent reviews are good examples of our focus on the long term. If rents become too high, we'll lose tenants and hence income, causing major disruption to residents and staff, reducing the value of our assets and risking damage to our reputation. Balancing rental growth with affordability is therefore a key part of providing sustainable returns for shareholders.
How we measure affordability
Rent cover is one of the most important KPIs for our business. We also track our rental growth and the amount of rent that's overdue:
| | Year ended | Year ended |
| | 31 December | 31 December |
| | 2024 | 2023 |
| Rent cover
Rent cover was strong through the year, reflecting our tenants' success in growing their fees, as well as further increases in occupancy. | 2.2x | 2.0x |
| Average rental growth
In total, 131 rent reviews added £1.7 million to our contracted rent in 2024. | 3.6% | 4.1% |
| Rent collection
We've collected 100% of the rent due in respect of 2024. Seven of the Group's properties are on variable-rent leases after being re-tenanted in 2024 from Melrose.
| 100% | 99% |
The chart below shows rent cover over time, demonstrating that rents have been consistently affordable for our tenants, as well as the scale of the improvement over the last 18 months:

The chart below sets out the rental growth we've achieved over the last seven years and compares the percentage increase with the rate of inflation. It shows that we've received above-inflation increases for much of this period, with our tenants being protected from high inflation during 2023 and 2024.

Affordability of our tenants' rent
An important indicator of whether our tenants' rent is affordable is whether their fees increase at or ahead of the rate of inflation. As shown below, care home operators have a long history of achieving this:

This continued in 2024. Across our portfolio, the average weekly fee (AWF) rose by 6.7% to £1,119, contributing to rising tenant profitability and rent cover.

In 2024 we invested £1 million in improving Kingston Court. On completion of the capex we had a Q&A with the home manager:
Q: What improvements did you want to make to the home and why?
A: The aim was two-fold; to increase the number of wet rooms and create a more comprehensive dementia-friendly environment.
We added 24 wet rooms to existing bedrooms and converted two unused lounges into four new wet room bedrooms. Alongside bedroom upgrades and additions, we enhanced our dementia-friendly environment with the addition of a library-themed coffee shop, local market-themed shop, a revitalised hair salon and themed corridors.
The new wet rooms we felt gave the home a more premium feel for those who prefer their own showering facilities over the communal, yet well-apportioned, bathrooms.
The dementia-specific areas were intended to enhance the lives of those living with dementia, providing destination areas to reminisce, discuss and reflect.
Q: How did you manage the works; was there any disruption?
A: Through planning with our project management team, contractor and our care teams we facilitated the works programme as smoothly as possible. Residents and families were made aware of the works programme well in advance to keep them informed and seek feedback.
Given our high occupancy level, it was important to keep a tight programme of works to release bedrooms and move residents to ensure there was no delay or unnecessarily empty bedrooms. The building contractor was flawless in managing this, as well as quiet and considerate. Disruption was kept to an absolute minimum.
Overall our residents were excited by the works and the improvements to come.
Q: What has been the response of residents, families and staff to the improvements that have been made?
A: The new wet rooms and bedrooms have been well received by current residents and have proved useful in attracting new residents to the home.
The library-themed coffee shop, local market-themed shop, revitalised hair salon and themed corridors have been a hit with residents - enriching their lives, sparking conversations and providing places to visit. New residents and their families are typically pleased with the quality of these areas and can quickly see the benefits the new facilities provide.
Our staff have always been committed to the residents and the home and the upgrades have further enhanced this commitment. Staff are immensely proud of the great care they deliver and now have an even better environment to match.
Q: How do you think those residents living with dementia will benefit?
A: The new dementia features have benefited our residents in many ways by promoting social interactions, engagement and activity, feelings of familiarity, calming, a sense of normal, physical movement and places for residents and staff or families to interact and reminisce.
It's great to see these benefits in action every day, and pleasing to hear visiting health and social care professionals delighted with further improvements in residents' lives we are delivering here.
Q: Have you noticed any difference in the electricity bills after you installed the solar panels on the roof?
A: Yes, the solar panels are contributing a healthy amount of electricity to the care home which we can monitor via a web portal. And at 80 bedrooms, it's all well used in both the summer and the winter months. It's also great for the planet and we are pleased to be playing our own small part in reducing the home's carbon footprint.
Kingston Court summary
Number of beds
80
2024 average occupancy
94%
Public/private fee split
85%/15%
Average EBITDARM margin (since January 2020)
27.5%
Putting our purpose into practice
4 | Increasing our sustainability
| | Year ended | Year ended | |
| | 31 December | 31 December | |
| | 2024 | 2023 | Change |
| EPCs rated B and above | 60% | 57% | |
| Carbon intensity (kg CO2e per m2 per year) | 51kg | 53kg | (3)% |
Care homes are an important part of the UK's social infrastructure and are set to play an increasing role in supporting older and vulnerable people.
Our ESG framework sets out our approach to implementation of ESG across the business. We invest in care homes which deliver positive social outcomes in the heart of the community.
Key pillars of our ESG framework
| Environment | Social | Governance |
| Priorities Strategic investment in our portfolio to improve environmental impact.
Improving EPCs through enhancements to our properties' energy efficiency and reduction in carbon emissions in line with our net zero pathway.
| Priorities Having a positive impact on the people living and working in our homes.
Recognising the vital social role care homes play and investing in homes that provide high-quality care to a range of residents. | Priorities Robust governance and transparent reporting to all stakeholders.
Maintaining effective partnerships with key stakeholders and providing clear and accountable data. |
| Objectives Ensure all assets achieve a minimum of EPC Grade C by 2026 and a minimum of B by 2030.
Ensure our portfolio is net zero by 2045.
Ensure our portfolio is resilient to climate change. | Objectives Support health and wellbeing of vulnerable people.
Ensure access to quality and value-for-money care for both the publicly funded and private-pay sectors.
| Objectives Be transparent with all stakeholders.
Maintain robust corporate governance.
Proactively listen and engage with public and private stakeholders.
|
| Aligns with the following UN Sustainable Development Goals 13, 11 | Aligns with the following UN Sustainable Development Goals 3, 10, 11 | Aligns with the following UN Sustainable Development Goals 8 |
Key pillars of our ESG framework
|
| Objectives | How we do it | Metrics | Update |
| ESG Pillar 1: Strategic investment in our portfolio to improve environmental impact. | Ensure all assets achieve a minimum of EPC Grade C by 2026 and a minimum of B by 2030. | Investing in assets that are highly energy efficient or have the potential to be with further capex. | Percentage of assets with EPC of C or higher. | 94% of portfolio rated C or higher (2023: 93%)1. |
| Ensure our portfolio is net zero by 2045, with interim targets of:
| Modelling the carbon footprint of the portfolio and implementing our net zero strategy and plan. | Number of assets with improved EPC.
| 14 homes with improved EPCs (2023: 12). | |
| | · 15% reduction from 2022 in absolute carbon emissions on a like-for-like basis by the end of 2025; and | Investing in asset management projects to improve energy efficiency. | Carbon intensity of portfolio in kg CO2e/m2/year. | 51kg CO2e/m2/year (2023: 53). |
| | · 50% reduction from 2022 in carbon emissions on a like-for-like basis by the end of 2030. | Climate change scenario planning. | Embodied carbon associated with developments and extensions. | Benchmark project 488kg CO2e per m2. |
| | Ensure our portfolio is resilient to climate change. | | Percentage of assets with green leases. | 17% (2023: 17%). |
| | | | Like-for-like carbon emissions. | A 4% increase from our 2022 baseline 14,143 tCO2e (2023: 14,413). |
| | | | Capex deployed on environmental improvements.
| £981k (2022: £741k. |
| ESG Pillar 2: Having a positive impact on the people living and working in our homes. | Support health and wellbeing of vulnerable people. | Investing in quality buildings and actively monitoring care provider performance. | Tenant satisfaction survey. | 93% rate relationship with Care REIT as moderately or very satisfied (2023: 87%). |
| Ensure access to quality and value-for-money care for both the publicly funded and private-pay sectors. | Developing close partnerships with operators through formal and informal engagement. | Affordability of rental payments to tenants. | Rent cover 2.21x (2023: 2x). | |
| | | Conducting detailed due diligence on long‑term need for care. | Proportion of publicly funded and private‑pay residents. | 69% of tenant income funded by NHS/LA (2023: 69%). |
| | | Maintaining balance of private and publicly funded residents. | CQC ratings. | Due to the low proportion of homes reviewed by the CQC during the year, we are looking at other indicators such as carehome.co.uk for which our tenants received an average score of 9.3 compared to the national average of 9.0.
|
| ESG Pillar 3: Robust governance and transparent reporting to all stakeholders. | Be transparent with all stakeholders. | Maintaining clear disclosures on operational performance. | Investment Manager's UN PRI submission. | UN PRI Signatory status retained. |
| Maintain robust corporate governance. | Maintaining policies on supplier code of conduct, anti-money laundering and bribery. | EPRA sustainability rating. | Gold rated (2023: Gold). | |
| | Proactively listen and engage with public and private stakeholders. | Managing the business in accordance with our responsible investment policy. | Carbon Disclosure Project rating. | D rated (2023: D). |
| | | Engaging with tenants on good governance practices. | | |
1. Based on English equivalent data for Scottish EPCs.
ESG Pillar 1: Environment
Improving the energy performance of our portfolio
Our target to improve the EPC ratings across our portfolio is to achieve a minimum B rating (or Scottish equivalent) by 2030, with an interim target of 50% by 2025.
During 2024, we continued to assess where we can improve EPC ratings through interventions such as building fabric improvements and improved energy efficiency. Examples of this are new electric air source heating systems, replacement windows and insulation, and the installation of solar panels at four projects.
Where we've implemented measures like these, we've updated the EPC in accordance with current building regulations. As a result, we're pleased to report a further increase in the proportion of our homes rated EPC B or higher across the portfolio. We are continuing to review assets that fall below an EPC band B to identify opportunities to improve these in line with our target for full coverage by 2030.
| | Target percentage of assets | Progress |
| Year | with an EPC of B or above1 | in 2024 |
| 2025 | 50% | 60%2 |
| 2030 | 100% | |

1. There may be cases where exemptions apply under MEES regulations, in which case we will provide all viable energy efficiency measures. The EPC B threshold is based off the England and Wales rating and equivalent methodology is applied for assets in Scotland.
2. Based on published EPC data for English equivalent rating from Scottish EPCs. The English equivalent for one Scottish property has been estimated based on comparable properties. The EPCs are those currently registered for each property and may be based off historic regulation and are therefore subject to change upon re-inspection.
Kingston Court case study
Kingston Court is a nursing home located close to Cumberland Infirmary in Carlisle and provides residential and nursing care for up to 80 residents. Our tenant, Careport, wanted to improve the offer for residents living with dementia whilst also improving the environmental performance of the building. We agreed a plan to invest £1 million in the building to create an additional four bedrooms from existing under-utilised day space. Central communal areas in the home have been converted into a café and library area, providing destination spaces for residents and families to enjoy.
Solar panels have been erected on the roof to generate renewable energy for the building. Since these panels were commissioned, they have generated 25% of the building's electricity, making them environmentally and economically beneficial with a projected payback period of five years.
Working with our tenants to deliver improved energy efficiency
The carbon emissions from the consumption of energy are the responsibility of our tenants, and therefore classed as "Scope 3" under the Greenhouse Gas Protocol. We continue to work closely with our tenants to help them reduce their carbon footprint, including investing in renewable energy technology on asset management projects. Over time we expect to invest further in energy improvements where the additional rental is affordable to our tenants.
We continue to improve our data collection on our tenants' energy consumption, with 93% coverage. As the quality and quantity of our data improves, we're in a better position to engage with tenants to identify opportunities where we can increase energy efficiency, reduce emissions, and reduce running costs.
Like-for-like carbon emissions reduced by 4% despite a small increase in the conversion factor for natural gas. Whilst we continue to review longer-term trends, this reduction is encouraging. However, our target of a 15% emissions reduction from our 2022 baseline is unlikely to be achieved given the increase in the previous year. Whilst helping our tenants to reduce their emissions remains important to us we will need to review our target for 2025 and how best to work in partnership with our tenants to help them become more energy efficient. However, our like-for-like emissions for 2024 were still 2% higher than the 2022 baseline.
| | 12 months to | 12 months to |
| | 30 Sep 2024 | 30 Sep 2023 |
| Building energy intensity (kWh per bed) | 10,850 | 11,036 |
| Building energy intensity like-for-like kWh/m2/year | 284 | 289 |
| Greenhouse gas emissions from building energy consumptions (tCO2 per bed) | 1.95 | 1.99 |
| Like-for-like total indirect greenhouse gas emissions (kg CO2e per m2) | 51 | 53 |
These emissions are classed as Scope 3 under the Greenhouse Gas Protocol and as such are not in our direct control; however, we continue to support our tenants in reducing emissions and advocate for greater energy efficiency.
ESG Pillar 2: Social
On average, 6,551 people were residents in our care homes during 2024. We set average rents which enable our tenants to charge fees which are more likely to be affordable to both the private self-pay market and those receiving local authority financial support.
As well as providing an appropriate community setting for residents, the homes in our portfolio are an important source of employment for a predominantly local workforce. Care homes rely on skilled and dedicated workers, but there are subtle differences between nursing homes (nurses must be on duty 24 hours per day) and residential homes (nurses are not a requirement). In both types of home, staff are required to undergo mandatory training and professional development, with staffing levels and qualifications being reviewed by the industry regulators. On average, over 9,000 people are employed in our care homes, meaning they play an important role in local communities and economies.
Care homes are highly regulated, and we work closely with our tenants to monitor the quality of care provided. This depends on our tenants employing properly trained care workers and there are numerous legal and regulatory requirements for mandatory training. Care workers therefore typically undertake c.36 hours of training every year as part of their ongoing development. In many cases this leads to career progression opportunities and greater responsibility.
ESG Pillar 3: Governance
During the year we reviewed existing and new policies including our Supplier Code of Conduct, ESG policy and, following the year end, we also approved a modern slavery statement which sets out our position against the use of any form of forced labour. We continue to engage on a regular basis with all our tenants to ensure they have up-to-date employment policies and practices.
We were pleased to retain our EPRA sBPR award for the fifth year running, demonstrating our commitment to transparent disclosure on the environmental performance of our portfolio. The IM is a signatory to the UN Principles for Responsible Investment (UN PRI) and has embedded those principles in its risk management and investment decision-making processes.
In 2024 we submitted our initial response to the Global Real Estate Sustainability Benchmark (GRESB), reporting for the calendar year 2023. In line with our expectations, we have received a one-star rating. Although in some respects our scale and the make-up of our portfolio do not align with the more generalised scoring in the GRESB framework, we believe we have a useful baseline from which to measure progress. During the year we also made our second annual submission to the Carbon Disclosure Project; with identified areas for improvement, we maintained an overall D rating.
Tenant satisfaction survey
In 2024 we again conducted a tenant survey, facilitated by an independent external body. We are pleased to report a 92% response rate, of which 93% (2023: 81%) of tenants reported having a positive relationship with Care REIT and viewed us a good long-term partner, and 86% (2023: 91%) reported satisfaction with Care REIT's level of engagement with them. We are always keen to get feedback from tenants and we seek to maintain and grow our positive relationships with them.
Charitable causes
In 2024, we were delighted to continue our partnership with The Care Workers' Charity. It supports care workers in times of need, particularly with mental health support, financial grants and advocating for care workers generally. As part of our support, a team from the IM completed the Yorkshire Three Peaks Challenge, raising funds of £3,000.
Putting our purpose into practice
5 | Delivering growth through enhancing our portfolio
| | Year ended | Year ended | |
| | 31 December | 31 December | |
| | 2024 | 2023 | Change |
| Contracted rent roll | £51.4m | £48.8m | +5.3% |
| Portfolio valuation | £679.0m | £651.3m | +4.3% |
Growing our business requires us to make strategic choices that influence our returns and the risks we face.
These choices include the types of assets we buy, where they are and how we use debt to finance our growth.
Our strategy: focusing on mid-market care homes
Our investment policy allows us to invest in different types of healthcare properties. Given the growing demand for care beds for the elderly, we've chosen to focus on care homes, in particular existing homes in the mid-market. These are attractive to us because:
· they provide a good setting for quality care;
· they have a larger target market than high-end homes, which should mean fewer unfilled beds for our tenants;
· they're lower risk than new developments, as the capital cost is significantly less per bed and they don't need to build their occupancy and staffing from scratch; and
· they often give us scope to add value through asset management.
In the fourth quarter of 2024, we invested in two homes. One is a 72-bed home being developed in Bedale, North Yorkshire, by our existing tenant Prestige Group. By funding the development for a capped price of £8.7 million, we'll be investing in a brand-new home for £121,000 per bed. The property will be fully electric and we expect it to have an EPC rating of A.
We also exchanged contracts to acquire Middleton Manor, an 83‑bed care home near Darlington, through a sale and leaseback with Prestige. All the bedrooms have en-suite bathrooms and the home has an EPC B rating. We'll pay up to £5.9 million for the asset, including a £2.1 million deferred payment based on the home's performance. The maximum cost equates to £71,000 per bed.
Both homes will be let to Prestige on new 35-year leases. The blended acquisition yield is very attractive at more than 8%, meaning the transactions should increase our income and should generate growth in capital values. We've had good results from a similar transaction with Prestige, when we funded the development of Merlin Manor in Hartlepool and acquired Yew Tree, an existing home in Redcar. Both these homes have performed well and the unlevered internal rate of return on our Merlin Manor investment is more than 20% to date.
Optimising our portfolio
We regularly review our portfolio to identify assets that are no longer core for us. In July 2024, we sold two care homes in Wales for a combined £4.5 million. We also exchanged contracts to sell three assets in East Yorkshire for £4.3 million, to a local care home business; as these had not completed by the year end they were classified as assets held-for-sale. This transaction should complete when the CQC approves the transfer to the new operator. The five homes sold were originally acquired as part of the seed portfolio purchased in May 2017 after the IPO. They were non-core because they've either underperformed, have low EPC scores or are smaller than the ideal size for a care home. The aggregate sale price of £8.8 million was in line with their most recent valuation. The disposals also reduce our reliance on Minster Group, our largest tenant, which operated these homes.
Section 172: maintaining high standards of business conduct
The IM and Minster Group are related parties. The relationship has many advantages for us but the directors also take the conflict of interest risk very seriously in their decision-making.
We sold the two care homes in Wales to an affiliate of Minster, making it a smaller related‑party transaction. To protect shareholders' interests, we commissioned a second independent valuation of these assets, which supported the sale price. This enabled the directors to approve the sale. Our financial advisers and corporate brokers also gave their opinion that the transaction was fair and reasonable as far as our shareholders were concerned.
Measuring our progress
In addition to our total accounting return and dividends, we use the following KPIs to monitor our returns from the portfolio:
| | Year ended | Year ended |
| | 31 December | 31 December |
| | 2024 | 2023 |
| Profit before tax Profits fell in the year, primarily due to the reduction in fair value gains year on year, partially offset by rental income increases.
| £45.0m | £48.8m |
| NAV The NAV increased by 3.4%, mainly due to rent reviews feeding through to valuation growth. The average topped-up NIY for the year was broadly flat.
| £494.5m | £478.1m |
| EPRA NTA per share The growth in net assets led directly to 3.7% growth in EPRA NTA per share, with the number of shares in issue unchanged during the year.
| 119.21p | 114.96p |
| Adjusted EPS Adjusted EPS benefited from higher income from rent reviews and rent increases from capital improvements, alongside strict control of operating costs, partially offset by higher interest costs.
| 7.42p | 7.28p |
Our strategy: diversifying the portfolio around the country
We manage risk by spreading the portfolio around the UK, so we don't rely on a small number of local markets. Most of our homes are in areas where asset prices are more attractive, there's strong demand for care and often less competition. This makes our homes an even more important part of their local communities.
At 31 December 2024, we owned homes in the following locations:
|
| Properties | Beds |
| ||
|
|
| Change in |
| Change in | % of portfolio |
| Location | Number | 2024 | Number | 2024 | market value |
| England |
|
|
|
|
|
| East Midlands | 8 | - | 405 | - | 5.8% |
| East of England | 9 | - | 547 | - | 9.9% |
| North East | 12 | - | 792 | +25 | 9.0% |
| North West | 33 | - | 1,358 | +4 | 15.4% |
| South East | 4 | - | 319 | - | 6.3% |
| South West | 9 | (1)1 | 550 | +8 | 10.2% |
| West Midlands | 14 | - | 862 | - | 13.9% |
| Yorkshire & The Humber2 | 11 | - | 693 | - | 6.1% |
| Northern Ireland | 5 | - | 340 | - | 3.5% |
| Scotland | 32 | - | 1,789 | - | 19.9% |
| Wales | - | (2) | - | (103) | - |
| Total | 137 | (3) | 7,655 | (66) | 100% |
1. Fairview Court and House were previously treated as two properties, with separate CQC registrations. Fairview now has a single CQC registration across both buildings and is therefore treated at one property. There is no change to the portfolio as a result of this.
2. Includes three properties classified as assets held-for-sale.
Our strategy: prudently financing our growth
We can grow the portfolio more quickly and increase returns by using an appropriate amount of debt. We're very aware of the risks of having too much leverage, so our policy is to:
· have a maximum gross loan-to-value (LTV) ratio of 35% at the time we draw down the debt; and
· have enough hedging to keep the risk of rising interest rates within our risk tolerance.
Our strategy: ensuring a good balance of funding for tenants' residents
We like our portfolio to have a good balance of funding for tenants' residents, from local authorities, the NHS and private pay. This helps to make our tenants' revenues more resilient than relying on one source of fees and means we earn a predictable income from our assets. It also has important social benefits, as we provide care homes for everyone.
With few changes to the portfolio in the year, funding for our tenants' fee income also remained steady and well balanced:

How we monitor our financing
We use the following KPIs to monitor our debt position:
| | Year ended | Year ended |
| | 31 December | 31 December |
| | 2024 | 2023 |
| EPRA net debt
Net debt increased by 7.2% in the year, largely due to our investment in asset management projects and Middleton Manor, less the proceeds from asset sales.
| £194.4m | £181.4m |
| EPRA (net) LTV
The EPRA (net) LTV decreased with the impact of higher net debt partially offset by rising asset values. Gross LTV was 28.3%, which remains well within our policy limit.
| 28.4% | 27.8% |
| Percentage of drawn debt that is fixed or hedged
£175 million of drawn debt is hedged via interest rate caps which expire in August 2025 (SONIA cap at 4% for £50 million) and January 2026 (SONIA cap at 3% for £50 million) and a private placement facility of £75 million at 3% fixed until 2034. | 88% | 95% |
Engaging with our shareholders and lenders
While all our stakeholders have an interest in the growth of our business and our financial stability, our shareholders, tenants and lenders are the most directly affected. Our engagement with our tenants and their residents is discussed on pages 13, 19 and 20 of the 2024 annual report respectively.
Understanding our shareholders' interests
The IM leads our investor relations programme and, along with our corporate brokers, ensures the board is kept well informed of shareholder views. Shareholder engagement in the year included the IM holding investor roadshows, with one taking place between the 2023 results announcement and the continuation vote at the AGM in May and the second following the interim results in August. Feedback from the meetings was positive, with shareholders appreciating the strength of our performance. We also organised shareholder visits to our assets, so they could see the quality of our care homes.
The Chair also offered meetings to our largest shareholders in the year, with several taking up the opportunity. Again, shareholders were complimentary about the Company and the IM, and while there were concerns about the share price discount to the NAV, they recognised this was a market issue rather than specific to the Company. They also emphasised the need to preserve capital and only invest in the best opportunities, in the current economic situation.
Understanding our lenders' interests
The IM also regularly engages with our debt providers, providing quarterly information that shows we're complying with the covenants in our debt facilities, offering site visits to homes within their security pool, and reporting on the performance of the tenants and the homes that the facilities are secured against.
Our principal risks
Our risk management process and how we categorise our risk appetite are discussed on pages 125 to 127 of the 2024 annual report. Our principal risks are as follows:
Infectious diseases
Probability: Medium
Impact: Moderate
Change in the year: No change
Risk appetite: Cautious
An outbreak of a significant new infectious disease would clearly place care home residents, who are naturally vulnerable, at significant danger. It may result in lower care home occupancy, reduced tenant profitability and higher costs. All of these would impact on the ability of our tenants to pay us rent, the value of our portfolio and our ability to work with tenants successfully.
How we manage this risk
COVID-19, together with other illnesses, means care home operators have experience of managing infectious diseases. Since the outbreak of COVID-19, we have increased our monitoring of occupancy statistics to a weekly format, giving us rapid feedback on this KPI. Also, having an affordable rent, and thus strong rent cover, enables our tenant operating partners to react better to unforeseen changes. In an extreme outbreak we would expect the government to support operators as they did through COVID-19; however, should they not provide this support, we have ensured that our business can sustain a delay in rent collection.
We continually work with our tenants to explore improvements to the homes; this can include ensuring the home is better protected to help with infection control, including air filtration, temperature sensors and unitisation of the home, to help with isolating outbreaks.
We believe that, especially with the learnings from the recent pandemic, the mitigations are sufficient to reduce the risk to moderate, and to be within our risk tolerance.
Opportunity
None.
Significant tenant default
Probability: Medium
Impact: Moderate
Change in the year: No change
Risk appetite: Cautious
This is the risk that either a single large tenant (more than 10% of rent roll) or several smaller tenants default. Any tenant failure is likely to cost us money (as the Silverline situation shows), but some tenants are larger than others. Failure of most tenants would have a moderate impact on us, but a Minster Group failure, as by far the largest group (33% of contracted rent), would be critical and is why the risk is outside of our risk tolerance. This could reduce our revenues and asset values.
How we manage this risk
Our close monitoring of tenants' performance enables us to spot issues quickly and we have shown we can replace a tenant if needed. Most tenants have seen improved profitability this year.
Our objective is for no tenant to account for more than 25% of our contracted rent. Accordingly, we aim to continue adding new tenants over time, to further diversify our income. We also maintain close contact with Minster and the IM receives quarterly accounts which they discuss in detail with the tenant, confirming its financial health.
Opportunity
None.
Underinvestment in care homes
Probability: Medium
Impact: Moderate
Change in the year: No change
Risk appetite: Cautious
Underinvestment could occur if: tenants don't invest in maintaining the properties, which could reduce the quality of care they can provide; the market or regulation may demand enhanced or different facilities; or, failure to consider the effects of climate change which could accelerate obsolescence (both physical and low carbon transition risks) and to meet our net zero target by 2045.
In addition, there is a risk that shorter-term leases of under ten years will affect the valuation of our portfolio.
How we manage this risk
All of our leases have full repair and maintenance obligations. In extreme circumstances, we can replace a tenant who fails to comply. We identify asset management opportunities before we buy assets and where appropriate we commit with our tenants to ensure this work begins in the first 12 to 18 months.
We are continuing to review our strategy for investing in homes to improve energy efficiency and environmental performance, including resilience to heat and flooding. We currently invest for an increase in rent, and are looking at using our buying power to reduce costs for our tenants.
We continue to wait for guidance on future environmental regulation. We have put this risk slightly outside of our risk tolerance.
In relation to the risk of valuation reduction from leases under ten years, across our care home portfolio our shortest leases are 12.3 years. We actively extend leases where significant development is undertaken and all new leases have a tenant-only option to extend at year ten. We are exploring options to extend historic leases.
Opportunity
We can fund building extensions or other improvements, in return for an increase in rent.
Economic disruption
Probability: High
Impact: Moderate
Change in the year: Increase
Risk appetite: Cautious
An economic downturn could have a moderate to significant impact on the business, but we believe that our mitigations are sufficient to bring it within our risk tolerance. Difficult economic conditions could put further pressure on local authority funding, affecting our tenants' fees and their ability to pay our rent.
Interest rates remain high and have been slow to fall, increasing the scrutiny on the financial covenants of our debt facilities which, if breached, could result in the banks taking security over our assets. Furthermore, the risk of economic disruption as a result of potential global events has increased in the year.
How we manage this risk
We can limit the impact of this risk by buying well, ensuring our tenants have strong rent cover, managing the assets to increase their value and managing the level of debt drawn across the Group.
Tenant profitability and long-term affordable rents are the key to a sustainable business. We regularly assess our tenants' financial performance, particularly their rent cover. The Care Act 2014 places responsibilities upon local authorities to support individuals who need care, which helps to mitigate this risk.
The board agrees cash flow and debt levels, maintaining a cautious leverage in line with our risk appetite. Our LTV cap is 35% and we are aiming to keep our debt levels well below this cap. We also have a policy to limit our exposure to increases in interest rates through fixed rate debt and interest rate caps. Our inflation-linked leases ensure our income grows every year, which supports property valuations.
Opportunity
Reduced asset valuations and/or higher debt costs may create attractive buying opportunities.
Political events
Probability: Medium
Impact: Moderate
Change in the year: Slight increase
Risk appetite: Cautious
In July 2024 a new Labour government was elected with a large majority. It is working on a ten‑year plan to improve the NHS, which is expected to be published at the end of the first quarter of 2025. The government has also announced the formation of a Royal Commission to look at reform of adult social care. However, the Commission will not deliver its full report until 2028. That means that during the life of this parliament it appears to be unlikely that there will be substantial changes to the way in which social care is funded and delivered.
How we manage this risk
We see this risk as moderate, because if the government were to change regulation that increases operational costs in care homes (for whatever reason) it would have to accept that fees would rise to pay for this - the alternative being tenants losing money and homes closing, which would be politically unacceptable and disastrous for local authorities and the NHS. Our tenants are used to providing care in the current imperfect environment. We have enhanced our knowledge of likely future developments in the health service and sought contact with opinion formers to increase their understanding of the sector.
Opportunity
Increased government funding could help the sector to grow and provide more opportunities for us to support adult social care.
Reputational damage
Probability: Medium
Impact: Moderate
Change in the year: No change
Risk appetite: Minimal
Circumstances that could damage our reputation include our tenants providing poor care or breaching standards around matters such as minimum wage or modern slavery. In addition, Minster Group is a related party to the IM. If there is a breakdown in trust on related party disclosures, this could damage our reputation.
We have also set targets to deliver net zero carbon by 2045; failure to deliver against our carbon reduction strategy could damage our reputation with investors and the community within which our care homes operate.
How we manage this risk
We are a responsible company and conscious of reputational risks, which we think could be critical if unmitigated, but are minor after the measures we take. We monitor tenants carefully for the quality of the care, through regular meetings, care home visits and CQC ratings. We only select tenants with high standards.
The board ensures we transparently disclose related party activities and take decisions in the best interest of stakeholders. The board also oversees the monitoring of our progress against our ESG targets. Whilst not on track for our interim net zero target in 2025, we continue to provide transparent reporting on our performance and the activities being undertaken to achieve our 2045 target.
Opportunity
None.
Investment Manager fails
Probability: Low
Impact: High
Change in the year: No change
Risk appetite: Minimal
We rely on the IM's capabilities to execute our strategy and support our day-to-day relationships. If the IM fails to retain key staff, this could result in poor relationships with stakeholders and, ultimately, failure to collect rent and a reduction in value of our portfolio.
How we manage this risk
The service requirements are set out in the Investment Management Agreement which the board monitors annually through the management engagement committee and more regularly through board member interactions with the IM. The IM is a well-run partnership closely bound into the success of the Company. In the last resort, the board believes that it could find an alternative manager to take over. The net risk is therefore within our risk tolerance.
Opportunity
None.
Other risks
There are several other risks that we monitor closely but we don't believe are principal risks for us. These include:
Taxation risk - We're a UK REIT and have to comply with certain rules to maintain that status. Any change to our tax status or in UK tax legislation could make it harder to achieve our investment objectives.
Cyber security - We need to protect our customer and company data from cyber attacks. Losing sensitive information could materially harm our financial condition. We have relatively few IT systems, as the IM runs our business and the Administrator runs the accounting and banking systems. The risk committee reviews our internal controls and provides assurance to the audit committee that they're effective. The audit committee also reviews our internal controls once a year.
Financial management - There's a risk that our budgets and plans are inaccurate, that we've made unrealistic assumptions or not applied them correctly, leading to our financial position deteriorating. The board reviews our financial results and any differences to our forecasts at least once a quarter, so we can investigate any issues.
Development activity - Developments are inherently risky and can face unexpected cost overruns and delays. High inflation and global supply chain delays have increased this risk over recent years. Through careful planning, site optimisation and ensuring our forward-fund commitments are capped, we seek to ensure all developments remain accretive to investors even if risks materialise.
Financial review
Portfolio valuation reflects income growth and stable market valuations
Cushman & Wakefield independently values our portfolio in accordance with the RICS Valuation - Professional Standard. As at 31 December 2024, the portfolio was valued at £679.0 million (31 December 2023: £651.3 million), up £27.7 million or 4.3%. The increase was made up as follows:
| | Contribution to valuation increase | |
| | £m | % |
| Capital improvements | 14.0 | 2.2 |
| Disposals | (4.5) | (0.7) |
| Valuation movement | 18.2 | 2.8 |
| Total | 27.7 | 4.3 |
The valuation increase of £18.2 million equates to 4.40 pence per share. This is made up of 5.46 pence per share resulting from inflation-linked rental growth, with (1.06) pence per share due to market value movements.
Resilient financial performance
Net rental income for the year increased by 9.6% to £54.1 million (2023: £49.4 million). This reflected:
· a full year of rental income from a portfolio of properties we invested in initially through an interest-bearing loan, which previously generated interest income rather than rental income. We converted these to freehold ownership in June 2023. Rental income was £3.1 million higher in 2024 as a result, with a corresponding reduction in interest income (see below); and
· rent reviews and rent increases following capital improvements, which added £1.6 million to net rental income in 2024.
Under IFRS, net rental income includes some rent we're required to recognise as income before we receive it, reflecting the minimum uplift in rents over the lease terms, on a straight‑line basis. Our cash rental income for the year increased by 10.9% to £47.2 million (2023: £42.5 million).
Our administrative and other expenses totalled £7.5 million (2023: £7.1 million), which led to a total expense ratio of 1.54% for the year (2023: 1.54%). The EPRA cost ratio reduced to 13.8% (2023: 14.4%) as we tightly controlled costs. This is a strong performance and our EPRA cost ratio is in the top quartile of our peer group.
Finance costs were £11.3 million (2023: £12.0 million), reflecting reduced amortisation of loan arrangement fees compared to 2023, where due to modification of loans, some brought‑forward arrangement fees were fully expensed in the year. Interest income was £0.2 million (2023: £3.8 million), with the 2023 figure including the £3.7 million of income discussed above.
The change in the fair value of investment properties was a gain of £18.2 million (2023: £14.8 million gain), contributing to profit before tax of £45.0 million (2023: £48.8 million).
EPS for the year was 10.85 pence (2023: 11.79 pence) and EPRA EPS was 8.89 pence (2023: 8.67 pence). Adjusted EPS, which strips out non-cash and one-off items, was 7.42 pence (2023: 7.28 pence). These EPS figures are all on both a basic and diluted basis. More information on the calculation of EPS can be found in note 11 to the financial statements.
Attractive and fully covered dividends
As a REIT, the Company must distribute at least 90% of its qualifying profits each year. The Company has therefore declared four quarterly dividends of 1.7375 pence each in respect of 2024, meeting the total dividend target of 6.95 pence per share, up 2.7% on the 6.77 pence paid in respect of 2023. All four dividends were Property Income Distributions.
The details of these dividends are as follows:
| | | | Cash cost |
| Quarter to | Declared | Paid | £m |
| 31 March 2024 | 25 April 2024 | 17 May 2024 | 7.2 |
| 30 June 2024 | 24 July 2024 | 16 August 2024 | 7.2 |
| 30 September 2024 | 24 October 2024 | 22 November 2024 | 7.2 |
| 31 December 2024 | 24 January 2025 | 21 February 2025 | 7.2 |
| Total |
|
| 28.8 |
We aim to deliver a dividend that's fully covered by adjusted earnings. The total dividend for 2024 was 128% covered by EPRA EPS and 107% covered by adjusted EPS. Our dividend target for 2025 is 7.20 pence per share1, an increase of 3.6% on 2024.
At 31 December 2024, the Company had distributable reserves of £113.6 million.
1. This is a target only and not a profit forecast. There can be no assurance that the target will be met and it should not be taken as an indicator of the Company's expected or actual results.
Portfolio valuation drives higher net asset value
The NAV at 31 December 2024 was £494.5 million, up 3.4% (31 December 2023: £478.1 million). NAV per share also increased by 3.4%, to 119.33 pence (31 December 2023: 115.38 pence).
The chart on page 40 of the 2024 annual report shows the main contributors to the movement in EPRA NTA per share. As we're required to pay out the large majority of our property rental earnings, the portfolio revaluation was the largest factor.
Strong and prudent balance sheet
There were no changes to our debt facilities during the year. Our year-end position is shown in the table below:
| | | | Drawn at | | |
| | | Facility size | 31 Dec 2024 | Propco interest | Propco LTV |
| | Expiry | (£m) | (£m) | cover covenant | covenant |
| Virgin Money | | | | | |
| RCF | Dec 2029 | 50.0 | 30.5 | 200% | 50% |
| HSBC | | | | | |
| RCF | Apr 2026 | 75.0 | 47.0 | 200% | 55% |
| NatWest | | | | | |
| RCF | Jun 20291 | 50.0 | 45.3 | 175%2 | 50% |
| Private placement | | | | | |
| Senior secured notes | Dec 2035 | 37.0 | 37.0 | 250% | 55% |
| Senior secured notes | Jun 2035 | 38.0 | 38.0 | 250% | 55% |
| Total |
| 250.0 | 197.8 |
|
|
1. With the option to extend for up to one year to June 2030, subject to NatWest's agreement.
2. Interest cover covenant is 175% until June 2025, after which it will increase to 200% for the remainder of the term.
At the year end, our debt facilities had an average maturity of 5.5 years (31 December 2023: 6.3 years). If we exercise the extension option on the NatWest facility, this increases to 5.7 years, with the earliest refinancing due in April 2026.
We had significant liquidity at 31 December 2024, with cash and cash equivalents of £10.5 million and undrawn debt facilities of £52.2 million. This gave us total headroom of £62.7 million, before accounting for our capital commitments.

Going concern and viability
The board regularly monitors the Company and Group's ability to continue as a going concern and its longer-term viability. The going concern assessment covers the 15-month period to 30 June 2026. Summaries of the Group's liquidity position, actual and prospective compliance with loan covenants and the financial strength of its tenants are considered at the scheduled quarterly board meetings. As part of the Group's assessment, the modelling includes (but is not limited to) the identification of uncertainties facing the Group, including:
· the risks of default of the Group's tenants, taking into consideration current rent cover. We review the occupancy performance of each tenant over the preceding 15 months and then run sensitivities by the tenant, including a drop in occupancy of 5%, an increase in staff costs by 5% and other costs by 10% and the effect these sensitivities have on rent cover and appraise the risk of a tenant default as low, medium or high; and
· the risk of a fall in investment property values. This may be because of a multitude of risks. We review the resulting impact on the Group's debt covenants and the remedial action that may be taken, including the extent of the resources available to the Company to cure covenant breaches.
The Group's forecasting model includes a variety of stress tests including reduction in investment property valuations, restriction of income from tenants (i.e. non-payment of rent), the costs associated with re-tenanting, the inclusion of increases in underlying costs and increases in interest rates. Reverse stress tests have been prepared to evaluate how much valuations or net income would need to fall to trigger defaults in each of the security pools.
Mitigating actions including corresponding reductions in costs as valuations fall, the use of unsecured properties to prevent covenant breaches and stopping dividends were also considered. The sensitivity scenarios reviewed by the audit committee and the board include:
· non-payment of rent for all medium and high-risk tenants for six months while increasing SONIA and bank base rates to 4.75% on variable interest rate loans;
· assessing the level of loss of rents that could be sustained within a security group before each covenant or default level is triggered; and
· assessing the loss of rents or valuation that could be sustained before the Group's unsecured assets would be fully utilised in application to cure rights within debt facilities.
The detailed scenario modelling is performed by the IM and presented to the audit committee and board for review, challenge and debate. The projections and scenarios considered in connection with the approval of this financial information had particular regard to stresses arising from rising inflation and interest rates and, in particular, the impact on the trading and financial strength of the Group's tenants as highlighted above.
Property values would need to fall by more than 40% before loan-to-value covenant breaches would arise with all facilities being fully drawn. Rental income would need to fall by 34% before interest cover covenant breaches would arise, with all facilities being fully drawn.
The board considered an extended 15-month going concern period was appropriate, owing to the refinancing of one £75 million revolving credit facility in April 2026. The interest received from current and prospective lenders to refinance this facility, low LTV across the Group and quantum of unsecured assets has given the board sufficient comfort that this does not pose a going concern issue.
Going concern statement
The board has weighed up the risks to going concern set out above, together with the ability of the Company to take mitigating action in response to those risks.
The board considers that the combination of their conclusions as to the tenants' prospects, the headroom available on debt covenants and the liquidity available to the Group to deal with stressed scenarios on income and valuation outlook, leads to a conclusion that the Company and the Group are each able to continue in business for the foreseeable future.
The board therefore considers it appropriate to adopt the going concern basis in the preparation of this financial information.
Viability statement
The period over which the directors consider it feasible and appropriate to report on the Group's viability is the five-year period to 31 March 2030. This period has been selected because it is the period that is used for the Group's medium-term business plans. The board considers the resilience of projected liquidity, as well as compliance with debt covenants, under a range of inflation and property valuation assumptions. These scenarios include stress tests and reverse stress tests consistent with those described in the paragraphs preceding the going concern statement and include a consideration of mitigating actions that may be taken to avert or mitigate potential threats to viability.
Given the longer period of assessment covered by the viability review, further analysis is conducted in order to test the reasonableness of the key assumptions made and to examine potential alternative outcomes and mitigating actions relating to those risks and assumptions.
These included:
· debt refinancings during the forecast period. In relation to additional refinancing obligations within the period of the viability assessment, the directors have reasonable confidence that extensions or replacement debt facilities will be put in place; and
· furthermore, the Group has the ability to make disposals of investment properties to meet its future financing requirements; however, this assessment did not assume any disposals took place.
Having considered the forecast cash flows and the impact of the sensitivities in combination, the directors confirm that they have a reasonable expectation that the Group will be able to continue in operation and meet its liabilities as they fall due over the five-year period ending 31 March 2030.
Section 172 statement
Section 172 of the Companies Act 2006 gives the directors several duties relating to the matters shown in the table below. During 2024, the directors consider that they've acted in good faith and in the way that would be most likely to promote the Company's success for the benefit of shareholders, while also considering the broad range of stakeholders who interact with our business.
| Matter | Response |
| a) The likely consequence of any decision in the long term.
| See page 23 of the 2024 annual report. |
| b) The interests of the company's employees.
| The Company doesn't have any employees, so this doesn't apply. |
| c) The need to foster the company's business relationships with suppliers, customers and others.
| Tenants: see pages 14, 20 and 28 of the 2024 annual report. Service providers: see pages 50 and 51 of the 2024 annual report. Lenders: see page 36 of the 2024 annual report. |
| d) The impact of the company's operations on the community and environment.
| See pages 20 and 23 of the 2024 annual report. |
| e) The desirability of the company maintaining a reputation for high standards of business conduct.
| See pages 20, 23 and 33 of the 2024 annual report. |
| f) The need to act fairly between members of the company. | The directors must ensure they treat all shareholders fairly when making their decisions. The board wasn't required to make any decisions in 2024 where any group of shareholders could be treated differently from others, so this issue didn't arise. |
Key board decisions
The board's key decisions in the year included approving:
· the acquisition of two assets;
· the disposal of five assets; and
· new tenants for the homes previously operated by Silverline.
The other significant matters the directors considered are shown on pages 48 to 50 of the 2024 annual report.
This strategic report was approved by the board on 12 March 2025 and signed on its behalf by:
Simon Laffin
Chair
Consolidated statement of comprehensive income
For the year ended 31 December 2024
| | | 31 December | 31 December |
| | | 2024 | 2023 |
| | Notes | £'000 | £'000 |
| Gross rental income | 5 | 54,146 | 49,659 |
| Bad debts written off | 5 | - | (236) |
| Insurance/service charge income | 5 | 690 | 871 |
| Insurance/service charge expense | 5 | (690) | (871) |
| Net rental income | | 54,146 | 49,423 |
| Administrative and other expenses | 6 | (7,476) | (7,137) |
| Loss on disposal of investment properties | 13 | (20) | (16) |
| Operating profit before changes in fair value | | 46,650 | 42,270 |
| Changes in fair value of investment properties | 13 | 9,462 | 14,788 |
| Operating profit | | 56,112 | 57,058 |
| Finance income | 8 | 234 | 3,761 |
| Finance expense | 9 | (11,328) | (11,988) |
| Profit before tax | | 45,018 | 48,831 |
| Tax charge on profit for the year | 10 | (57) | - |
| Profit and total comprehensive income (attributable to shareholders) | | 44,961 | 48,831 |
| Earnings per share - basic and diluted (pence) | 11 | 10.85p | 11.79p |
The results are derived from continuing operations during the year; the Group had no other comprehensive income in the current or prior year.
Consolidated statement of financial position
As at 31 December 2024
| | | 31 December | 31 December |
| | Notes | 2024 | 2023 |
| | | £'000 | £'000 |
| Non-current assets | |
| |
| Investment property | 13 | 630,788 | 616,006 |
| Interest rate derivatives | 19 | - | 1,750 |
| Trade and other receivables | 15 | 51,511 | 39,237 |
| Total non-current assets | | 682,299 | 656,993 |
| Current assets | |
| |
| Assets held-for-sale | 14 | 4,175 | - |
| Trade and other receivables | 15 | 565 | 907 |
| Interest rate derivatives | 19 | 484 | - |
| Cash and cash equivalents | 16 | 10,492 | 9,389 |
| Total current assets | | 15,716 | 10,296 |
| Total assets | | 698,015 | 667,289 |
| Current liabilities | |
| |
| Trade and other payables | 17 | (6,891) | (6,915) |
| Total current liabilities | | (6,891) | (6,915) |
| Non-current liabilities | |
| |
| Borrowings | 18 | (193,408) | (179,937) |
| Trade and other payables | 17 | (3,260) | (2,330) |
| Total non-current liabilities | | (196,668) | (182,267) |
| Total liabilities | | (203,559) | (189,182) |
| Total net assets | | 494,456 | 478,107 |
| Equity | |
| |
| Share capital | 22 | 4,144 | 4,144 |
| Share premium reserve | 22 | 376,716 | 376,716 |
| Capital reduction reserve | 22 | 24,077 | 24,077 |
| Retained earnings | | 89,519 | 73,170 |
| Total equity | | 494,456 | 478,107 |
| Net asset value per ordinary share (pence) | 24 | 119.33p | 115.38p |
The consolidated financial statements for Care REIT plc (registered number: 10464966) were approved and authorised for issue by the board of directors on 12 March 2025 and are signed on its behalf by:
Simon Laffin
Chair
Consolidated statement of cash flows
For the year ended 31 December 2024
| | | 31 December | 31 December |
| | | 2024 | 2023 |
| | Notes | £'000 | £'000 |
| Cash flows from operating activities | |
| |
| Profit for the year (attributable to equity shareholders) | | 44,961 | 48,831 |
| Finance income | 8 | (234) | (3,761) |
| Finance expense | 9 | 11,328 | 11,988 |
| Loss on disposal of investment properties | 13 | 20 | 16 |
| Changes in fair value of investment properties | 13 | (9,462) | (14,788) |
| Net cash flow before working capital changes | | 46,613 | 42,286 |
| Working capital changes | |
| |
| Increase in trade and other receivables | | (7,068) | (6,308) |
| Increase/(decrease) in trade and other payables | | 1,104 | (2,618) |
| Net cash flow generated from operating activities | | 40,649 | 33,360 |
| Investing activities | |
| |
| Purchase of investment properties | | - | (44,799) |
| Proceeds on sale of investment property | | 4,480 | 1,234 |
| Acquisition costs capitalised | | - | (1,765) |
| Capital improvements | | (14,225) | (3,375) |
| Loan advanced to operator | | - | (1,600) |
| Loan advanced to operator for development funding | 15 | (5,000) | - |
| Interest received | | 290 | 3,695 |
| Net cash flow used in investing activities | | (14,455) | (46,610) |
| Financing activities | |
| |
| Issue costs of ordinary share capital | 22 | - | (30) |
| Borrowings drawn | 18 | 44,000 | 82,500 |
| Borrowings repaid | 18 | (31,000) | (40,000) |
| Loan arrangement fees paid | | (714) | (2,827) |
| Loan commitment fees paid | | (589) | (528) |
| Purchase of derivative | 19 | - | (3,238) |
| Interest payments received on interest rate derivatives | 19 | 1,676 | 1,035 |
| Interest paid on bank borrowings | | (9,852) | (8,990) |
| Dividends paid to equity holders | 12 | (28,612) | (27,814) |
| Net cash flow (used in)/generated from financing activities | | (25,091) | 108 |
| Net increase/(decrease) in cash and cash equivalents for the year | | 1,103 | (13,142) |
| Cash and cash equivalents at the start of the year | | 9,389 | 22,531 |
| Cash and cash equivalents at the end of the year | 16 | 10,492 | 9,389 |
Consolidated statement of changes in equity
For the year ended 31 December 2024
| | | | | Capital | | |
| | | Share | Share | reduction | Retained | |
| | | capital | premium | reserve | earnings | Total |
| | Notes | £'000 | £'000 | £'000 | £'000 | £'000 |
| 1 January 2024 | | 4,144 | 376,716 | 24,077 | 73,170 | 478,107 |
| Total comprehensive income | | - | - | - | 44,961 | 44,961 |
| Transactions with owners | | | | | | |
| Dividends paid | 12 | - | - | - | (28,612) | (28,612) |
| 31 December 2024 |
| 4,144 | 376,716 | 24,077 | 89,519 | 494,456 |
| | | | | | | |
| For the year ended 31 December 2023 |
|
|
|
| ||
| | | | | Capital | | |
| | | Share | Share | reduction | Retained | |
| | | capital | premium | reserve | earnings | Total |
| | Notes | £'000 | £'000 | £'000 | £'000 | £'000 |
| 1 January 2023 | | 4,048 | 365,642 | 24,077 | 52,153 | 445,920 |
| Total comprehensive income | | - | - | - | 48,831 | 48,831 |
| Transactions with owners | | | | | | |
| Dividends paid | 12 | - | - | - | (27,814) | (27,814) |
| Share issue | 22 | 96 | 11,104 | - | - | 11,200 |
| Share issue costs | 22 | - | (30) | - | - | (30) |
| 31 December 2023 | | 4,144 | 376,716 | 24,077 | 73,170 | 478,107 |
Notes to the consolidated financial statements
For the year ended 31 December 2024
1. Basis of preparation
General information
The consolidated financial statements for the year ended 31 December 2024 are prepared in accordance with UK-adopted international accounting standards.
The financial information does not constitute the Group's financial statements for the periods ended 31 December 2024 or 31 December 2023, but is derived from those financial statements. Financial statements for the year ended 31 December 2023 have been delivered to the Registrar of Companies and those for the year ended 31 December 2024 will be delivered following the Company's Annual General Meeting. The auditor's reports on both the 31 December 2023 and 31 December 2024 financial statements were unqualified; did not draw attention to any matters by way of emphasis; and did not contain statements under section 498 (2) or (3) of the Companies Act 2006.
The consolidated financial statements have been prepared on a historical cost basis, except for investment properties and interest rate derivatives, which have been measured at fair value.
The Group has chosen to adopt EPRA best practices recommendations guidelines for calculating key metrics such as EPRA earnings per share, most recently updated in September 2024.
The Company is a public listed company incorporated and domiciled in England and Wales. The Company's ordinary shares are listed on the main market of the London Stock Exchange. The registered address of the Company is disclosed in the corporate information.
Convention
The consolidated financial statements are presented in Sterling, which is also the Group's functional currency, and all values are rounded to the nearest thousand (£'000), except when otherwise indicated.
Going concern
The strategic report describes the Group's financial position, cash flows and liquidity position. The principal risks are set out in this report and note 20 to the financial statements also provides details of the Group's financial instruments and its exposure to liquidity and credit risk.
The ongoing effect of inflated costs and the high-interest rate environment has been considered by the directors. The directors have reviewed the forecasts for the Group taking into account the impact of heightened interest rates and costs on trading over the 15 months from the date of signing this annual report. The forecasts have been assessed against a range of possible downside outcomes incorporating significantly lower levels of income and higher costs. The expiry of one of the Group's revolving credit facilities in April 2026 has been considered by the directors in the extended 15-month going concern review period; see going concern and viability for further detail.
The directors believe that there are currently no material uncertainties in relation to the Group's ability to continue for a period of at least 15 months from the date of approval of the Group's financial statements. The board is, therefore, of the opinion that the going concern basis adopted in the preparation of the annual report is appropriate.
2. Significant accounting judgements, estimates and assumptions
The preparation of the Group's financial statements requires management to make judgements, estimates and assumptions that affect the reported amounts recognised in the financial statements and disclosures. However, uncertainty about these assumptions and estimates could result in outcomes that could require material adjustment to the carrying amount of the assets or liabilities in future periods.
Information about significant areas of estimation, uncertainty and critical judgements in applying accounting policies that have the most significant effect on the amounts recognised in the financial statements are disclosed below.
2.1. Judgements
Operating lease contracts - the Group as lessor
The Group has acquired investment properties that are subject to commercial property leases with tenants. The Group has determined, based on an evaluation of the terms and conditions of the arrangements, particularly the duration of the lease terms and minimum lease payments, that it retains all the significant risks and rewards of ownership of these properties and so accounts for the leases as operating leases.
The leases, when signed, are typically for between 20 and 30 years, typically with a tenant-only option to extend for one or two periods of ten years. At the inception of the lease, management do not judge any tenant-only option to extend the leases to be reasonably certain and, as such, do not factor these lease extensions into their considerations of lease incentives and their treatment.
2.2. Estimates
Fair valuation of investment property
The valuations have been prepared in accordance with the RICS Valuation - current edition of the global and UK standards as at the valuation date, or the RICS "Red Book" as it has become widely known.
The basis of value adopted is that of fair value being "the price that would be received to sell an asset or paid to transfer a liability in an orderly transaction between market participants at the measurement date" in accordance with IFRS 13. The concept of fair value is considered to be consistent with that of market value.
The significant methods and assumptions used by the valuers in estimating the fair value of the investment properties are set out in note 13.
Gains or losses arising from changes in the fair values are included in the consolidated statement of comprehensive income in the period in which they arise. In order to avoid double counting, the assessed fair value may be increased or reduced by the carrying amount of any accrued income resulting from the spreading of lease incentives and/or guaranteed minimum rent uplifts at the inception of the lease.
The nature of uncertainty regarding the estimation of fair value as well as sensitivity analysis has been considered as set out in note 13.
3. Summary of material accounting policies
The principal accounting policies applied in the preparation of these consolidated financial statements are set out below or alongside the relevant note.
Basis of consolidation
The consolidated financial statements comprise the financial statements of the Company and all of its subsidiaries drawn up to 31 December 2024. Subsidiaries are those entities, including special purpose entities, controlled by the Company. Control exists when the Company is exposed, or has rights, to variable returns from its investment with the investee and has the ability to affect those returns through its power over the investee. In assessing control, potential voting rights that presently are exercisable are taken into account. The financial statements of subsidiaries are included in the consolidated financial statements from the date that control commences until the date that control ceases.
Segmental information
The board is of the opinion that the Group is engaged in a single segment business, being the investment in the United Kingdom in healthcare assets. The board considers that these properties have similar economic characteristics and as a result these individual properties have been aggregated into a single reportable operating segment. Reporting on tenants providing greater than 10% of revenue is included in note 5.
4. New standards issued
4.1. New standards issued with effect from 1 January 2024
No new standards have been applied that have had a material effect on the financial position or performance of the Group.
4.2. New standards issued but not yet effective
There are no new standards issued but not yet effective that are expected to have a material effect on the Group.
5. Property income
| | Year ended | Year ended |
| | 31 December | 31 December |
| | 2024 | 2023 |
| | £'000 | £'000 |
| Rental income cash received in the year | 47,162 | 42,513 |
| Rent received in advance of recognition1 | 78 | 141 |
| Rent recognised in advance of receipt2 | 7,095 | 7,145 |
| Rental lease incentive amortisation3 | (189) | (140) |
| Gross rental income | 54,146 | 49,659 |
| Bad debts written off | - | (236) |
| Insurance/service charge income | 690 | 871 |
| Insurance/service charge expense | (690) | (871) |
| Net rental income | 54,146 | 49,423 |
1. This relates to movement in rent premiums received in prior periods as well as any rent premiums received during the year, deemed to be a premium over the term of the lease.
2. Relates to movement in rent-free periods being recognised on a straight-line basis over the term of the lease and rent recognised in the period to reflect the minimum uplift in rents over the term of the lease on a straight-line basis.
3. Lease incentives relate to the amortisation of payments made to tenants that are not part of any acquisition contractual obligations. These payments are made in return for an increase in rent.
For accounting purposes, premiums received are reflected on a straight-line basis over the term of the lease. In addition, the Group benefits from a minimum annual rental uplift of 1% or 2% on most of its leases. For accounting purposes, these uplifts are also incorporated to recognise income on a straight-line basis.
Insurance/service charge relates to property insurance that is paid by the Group and recharged to tenants.
Minster Care Management Limited and Croftwood Care UK Limited are both part of the Minster Care Group Limited and together represent 35.6% (2023: 38.4%) of gross rental income:
| | 2024 | 2023 |
| Minster Care Management Limited | 22.5% | 24.9% |
| Welford | 20.7% | 17.1% |
| Croftwood Care UK Limited | 13.1% | 13.5% |
| Holmes Care Group | 14.6% | 12.5% |
| Others | 29.1% | 32.0% |
Accounting policy
Rental income
Rental income arising on investment properties is included in gross rental income in the consolidated statement of comprehensive income and is accounted for on a straight-line basis over the lease term. The change in the RPI is reviewed annually, with the minimum uplifts being taken into consideration when accounting for the rental income on a straight-line basis upon inception of the lease. The resulting asset or liability is reflected as a receivable or payable in the consolidated statement of financial position.
When a contract includes both lease and non-lease components, the Group applies IFRS 16 to allocate the consideration under the contract to each component.
The valuation of investment properties is increased or reduced by the total of the unamortised lease incentive and straight-line receivable or payable balances. Any remaining balances in respect of properties disposed of are included in the calculation of the profit or loss arising at disposal.
The initial lease rental payments and guaranteed rental uplifts are spread evenly over the lease term, even if payments are not made on such a basis. The lease term is the non-cancellable period of the lease together with any further term for which the tenant has the option to continue the lease, except for where, at the inception of the lease, the directors have no certainty that the tenant will exercise that option.
Increased rental payments arising from lease variations following the completion of agreed capital improvements are spread evenly over the remaining lease term from the date of the lease variation.
At each rent review, the uplift in rent is calculated in accordance with the terms of the lease. If greater than the minimum uplift then the uplift above and beyond the minimum recognised is calculated and recognised in the period in which it arises, with there being no rebasing of the amounts to recognise over the remaining lease.
Service charges, insurance and other expenses recoverable from tenants
Income arising from expenses recharged to tenants is recognised in the year which the compensation becomes receivable. Service, insurance and other similar charges that are recoverable are included in gross rental income as the directors consider that the Group acts as principal in this respect.
6. Administrative and other expenses
| | Year ended | Year ended |
| | 31 December | 31 December |
| | 2024 | 2023 |
| | £'000 | £'000 |
| Investment Manager fees (see note 23) | 5,022 | 4,810 |
| Directors' remuneration (see note 7) | 265 | 276 |
| Auditor's fees |
| |
| - Statutory audit of the Company and Group | 294 | 250 |
| - Statutory audit of the subsidiaries | 51 | 52 |
| - Agreed-upon procedures for the Company's interim report | 19 | 17 |
| Total auditor's fees | 364 | 319 |
| Administration fees | 399 | 523 |
| Regulatory fees | 25 | 34 |
| Legal and professional | 1,003 | 912 |
| Recruitment services and remuneration committee advice | 7 | 32 |
| Other administrative costs | 391 | 231 |
| | 7,476 | 7,137 |
The amounts shown above include irrecoverable VAT as appropriate. The 2024 audit fee above includes £17,000 in respect of overruns relating to 2023.
7. Directors' remuneration
The Group had no employees in the current or prior year. The directors, who are key management personnel of the Company, are appointed under letters of appointment for services. Directors' remuneration, all of which represents their fees for services provided during the year, is as follows:
| | Year ended | Year ended |
| | 31 December | 31 December |
| | 2024 | 2023 |
| | £'000 | £'000 |
| Simon Laffin (Chair) | 60 | 55 |
| Rupert Barclay (resigned) | - | 15 |
| Rosemary Boot | 40 | 40 |
| Philip Hall (resigned) | 16 | 40 |
| Paul Craig (resigned) | - | 15 |
| Amanda Aldridge | 46 | 46 |
| Chris Santer | 40 | 40 |
| Cedi Frederick | 30 | - |
| | 232 | 251 |
| Employer's National Insurance | 33 | 25 |
| | 265 | 276 |
Directors' remuneration payable at 31 December 2024 amounted to £12,868 (2023: £18,440).
8. Finance income
| | Year ended | Year ended |
| | 31 December | 31 December |
| | 2024 | 2023 |
| | £'000 | £'000 |
| Bank interest | 168 | 55 |
| Loan interest | 66 | 3,706 |
| | 234 | 3,761 |
Loan interest income relates to interest on working capital loans made to operators.
Accounting policy
Finance income
Finance income is accounted for on an accruals basis.
9. Finance expenses
| | | Year ended | Year ended |
| | | 31 December | 31 December |
| | | 2024 | 2023 |
| | Note | £'000 | £'000 |
| Interest payable on bank borrowings | | 10,113 | 9,584 |
| Commitment fee payable on borrowings | | 589 | 528 |
| Amortisation of loan arrangement fee | | 955 | 1,418 |
| Changes in fair value of interest rate derivatives | 19 | (329) | 458 |
| | | 11,328 | 11,988 |
The total interest payable on financial liabilities carried at amortised cost comprises interest payable on borrowings, which was £177.6m at 31 December 2024 (2023: £184.8m). Amortisation on loan arrangement fees relates to capitalised fees being amortised over the term of the facility; in the year ended 31 December 2024 £0.5m was capitalised (2023: £1.2m).
Accounting policy
Finance expenses
Finance expenses consist principally of interest payable, amortisation of loan arrangement fees and fair value movements on interest rate derivatives.
Loan arrangement fees are expensed over the term of the relevant loan. Interest payable and other finance costs which the Group incurs on bank facilities are expensed in the period to which they relate.
10. Taxation
As a REIT, the Group is exempt from corporation tax on the profits and gains from its property investment business, provided it continues to meet certain conditions as per REIT regulations. For the year ended 31 December 2024 and the year ended 31 December 2023, the Group did not have any non-qualifying profits except interest income.
Tax charge in the consolidated statement of comprehensive income:
| | Year ended | Year ended |
| | 31 December | 31 December |
| | 2024 | 2023 |
| | £'000 | £'000 |
| UK corporation tax | 57 | - |
Reconciliation of the corporation tax charge:
| | Year ended | Year ended |
| | 31 December | 31 December |
| | 2024 | 2023 |
| | £'000 | £'000 |
| Profit before tax | 45,018 | 48,831 |
| Theoretical tax at UK corporation tax rate 25% (2023: 23.5%) | 11,255 | 11,475 |
| Effects of: |
| |
| REIT exempt profits | (8,750) | (8,860) |
| Non-taxable items | (2,448) | (2,615) |
| Total tax charge1 | 57 | - |
1. Tax charge relates to taxable interest income which was not offset by Group losses.
Under the UK REIT rules within which the Group operates, capital gains on the Group's UK properties are generally exempt from UK corporation tax, provided they are not held for trading.
Accounting policy
Taxation
The Group is a REIT in relation to its property investments and is therefore exempt from tax, subject to the Group maintaining its REIT status.
Current tax is the expected tax payable on any non-REIT taxable income for the year, using tax rates enacted or substantively enacted at the balance sheet date.
11. Earnings per share
Earnings per share (EPS) amounts are calculated by dividing profit for the period attributable to ordinary equity holders of the Company by the time-weighted average number of ordinary shares outstanding during the period. As there are no dilutive instruments outstanding, basic and diluted earnings per share are identical.
| | Year ended | Year ended |
| | 31 December | 31 December |
| | 2024 | 20231 |
| | £'000 | £'000 |
| Total comprehensive income (attributable to shareholders) | 44,961 | 48,831 |
| Adjusted for: |
| |
| - Revaluation movement | (18,227) | (21,934) |
| - Rental lease incentive | 1,592 | (140) |
| - Rental income arising from recognising rental premiums and future guaranteed rent uplifts | 7,173 | 7,286 |
| Change in fair value of investment properties | (9,462) | (14,788) |
| Loss on disposal of investment property | 20 | 16 |
| Interest received on interest rate cap | 1,595 | 1,393 |
| Change in fair value of interest rate derivative | (329) | 458 |
| EPRA earnings | 36,785 | 35,910 |
| Adjusted for: |
| |
| Rental income arising from recognising rental premiums and future guaranteed rent uplifts | (7,173) | (7,287) |
| Amortisation of lease incentives | 189 | 141 |
| Amortisation of loan arrangement fees | 955 | 1,418 |
| Loss on disposal of investment property | (20) | (16) |
| Adjusted earnings | 30,736 | 30,166 |
| Average number of ordinary shares | 414,368,169 | 414,157,674 |
| Basic and diluted earnings per share (pence) | 10.85p | 11.79p |
| EPRA basic and diluted earnings per share (pence)1 | 8.89p | 8.67p |
| Adjusted basic and diluted earnings per share (pence) | 7.42p | 7.28p |
1. The 2023 EPRA earnings has been restated in line with updated guidance from EPRA released in 2024 revising the calculation to include cash income received on interest rate derivatives.
The European Public Real Estate Association (EPRA) publishes guidelines for calculating adjusted earnings designed to represent core operational activities.
The EPRA earnings are arrived at by adjusting for the changes in fair value of investment properties and interest rate derivatives, and removal of profit or loss on disposal of investment properties.
The effect of the most recent change in guidelines resulted in the interest received on the interest rate cap of £1,595,000 (2023: £1,393,000) being recognised in EPRA earnings rather than only in adjusted earnings.
Adjusted earnings
Adjusted earnings is used by the board to help assess the Group's ability to deliver a cash covered dividend from recurring net income. The metric adjusts EPRA earnings by other non‑cash items credited or charged to the Group statement of comprehensive income including the effect of straight-lining of rental income from fixed rental uplift adjustments and amortisation of loan arrangement fees. The metric also adjusts for any one-off costs that are not expected to be recurring and for cash items which are excluded from the EPRA earnings calculation such as interest income on hedging arrangement.
Fixed rental uplift adjustments relate to adjustments to net rental income on leases with minimum uplifts embedded within their review profiles. The total minimum income recognised over the lease term is recognised on a straight-line basis and therefore not supported by cash flows during the early term of the lease, but this reverses towards the end of the lease.
The board uses the adjusted earnings alongside the available distributable reserves in its consideration and approval of dividends.
12. Dividends
| | | Year ended | Year ended |
| | | 31 December | 31 December |
| | Dividend rate | 2024 | 2023 |
| | (pence per share) | £'000 | £'000 |
| Fourth interim dividend for the period ended 31 December 2022 (ex-dividend - 31 January 2023) | 1.6350p | - | 6,775 |
| First interim dividend for the period ended 31 December 2023 (ex-dividend - 25 April 2023) | 1.6925p | - | 7,013 |
| Second interim dividend for the period ended 31 December 2023 (ex-dividend - 9 August 2023) | 1.6925p | - | 7,013 |
| Third interim dividend for the period ended | |
| |
| 31 December 2023 (ex-dividend - | |
| |
| 20 October 2023) | 1.6925p | - | 7,013 |
| Fourth interim dividend for the period ended 31 December 2023 (ex-dividend - | |
| |
| 8 February 2024) | 1.6925p | 7,012 | - |
| First interim dividend for the period ended | |
| |
| 31 December 2024 (ex-dividend - | |
| |
| 2 May 2024) | 1.7375p | 7,200 | - |
| Second interim dividend for the period ended 31 December 2024 (ex-dividend - | |
| |
| 1 August 2024) | 1.7375p | 7,200 | - |
| Third interim dividend for the period ended | |
| |
| 31 December 2024 (ex-dividend - | |
| |
| 7 November 2024) | 1.7375p | 7,200 | - |
| Total dividends paid | | 28,612 | 27,814 |
| Total dividends paid in respect of the year | | 5.2125p | 5.0775p |
| Total dividends unpaid but declared in respect of the year | | 1.7375p | 1.6925p |
| Total dividends declared in respect of the year - per share | | 6.95p | 6.77p |
On 30 January 2024, the Company declared an interim dividend of 1.6925 pence per share for the period from 1 October 2023 to 31 December 2023 which was paid on 23 February 2024.
On 25 April 2024, the Company declared an interim dividend of 1.7375 pence per share for the period from 1 January 2024 to 31 March 2024 which was paid on 17 May 2024.
On 24 July 2024, the Company declared an interim dividend of 1.7375 pence per share for the period from 1 April 2024 to 30 June 2024 which was paid on 16 August 2024.
On 24 October 2024, the Company declared an interim dividend of 1.7375 pence per share for the period 1 July 2024 to 30 September 2024 which was paid on 22 November 2024.
On 24 January 2025, the Company declared an interim dividend of 1.7375 pence per share for the period 1 October 2024 to 31 December 2024 which was paid on 21 February 2025.
Accounting policy
Dividends
Dividends are recognised when they become legally payable.
13. Investment property
In accordance with the RICS "Red Book" the properties have been independently valued on the basis of fair value by Cushman & Wakefield, an accredited independent valuer with a recognised professional qualification. They have recent and relevant experience in the locations and categories of investment property being valued and skills and understanding to undertake the valuations competently. The properties have been valued on an individual basis and their values aggregated rather than the portfolio valued as a single entity. The valuers have used recognised valuation techniques in accordance with those recommended by the International Valuation Standards Committee and are compliant with IFRS 13. Factors reflected include current market conditions, annual rentals, lease lengths, property condition including improvements effected during the year, rent coverage, location and comparable evidence.
The valuers of the Group property portfolio have a working knowledge of the various ways that environmental, social and governance factors can impact the value of property:
· environmental and sustainability standards, which vary across parts of the UK, are also referenced within the valuers' report. The valuers also note that they continue to monitor the wider property market for evidence of transactional activity that evidences the views of market participants in this area;
· with regard to social, there are fewer established benchmarks in this area but the valuers are aware that care homes generally meet a social need to residents and are also employment providers; and
· concerning governance, within the care sector in the UK, the valuers reflect the latest available regulatory reports from the various regulatory bodies within the UK (being CQC, Care Inspectorate and RQIA).
The Group continues to share recently conducted physical climate and transitional risk assessments with the valuers, which they have reviewed and reflected in their valuations to the extent that current market participants would do so.
Valuers observe, assess and monitor evidence from market activities, including market sentiment on issues such as longer-term obsolescence and, where known, future environmental, social and governance related risks and issues which may include, for example, the market's approach to capital expenditure required to maintain the utility of the asset.
In the absence of reliable benchmarking data and indices for estimating costs, specialist advice on cost management may be required which is usually agreed with the valuer in the terms of engagement and without reasonable estimates/assumptions may be needed to properly reflect market expectations in arriving at the valuation.
The valuations are the ultimate responsibility of the directors. Accordingly, the critical assumptions used in establishing the independent valuation are reviewed by the board.
| | As at | As at |
| | 31 December | 31 December |
| | 2024 | 2023 |
| | £'000 | £'000 |
| Opening value | 651,313 | 532,479 |
| Property additions | - | 91,688 |
| Property disposals1 | (4,500) | (1,250) |
| Acquisition costs capitalised | - | 1,765 |
| Capital improvements | 13,996 | 4,697 |
| Revaluation movement | 18,227 | 21,934 |
| Closing value per independent valuation report | 679,036 | 651,313 |
| Transfer to assets held-for-sale (note 14) | (4,175) | - |
| Guaranteed rent reviews debtor | (42,353) | (35,258) |
| Lease incentive debtor | (3,971) | (2,379) |
| Rent premium creditor | 2,251 | 2,330 |
| Closing fair value per consolidated statement of financial position | 630,788 | 616,006 |
1. In 2024 the carrying value of disposals was £4,500,000 (2023: £1,250,000). This, combined with the loss on disposal of £20,000 (2023: £16,000 profit) makes up the total net proceeds shown in the consolidated statement of cash flows.
There were no additions during the current year. During the prior year, the Group acquired an additional £91.7m assets, of which £35.7m relates to a portfolio which was purchased via a loan to operator in December 2021 where the Group had an option to acquire, this option was exercised in June 2023, and £56m relates to the purchase of a portfolio in 2023 where 20% of the consideration was made up of shares in the Company. During the year the Group disposed of £4.5m of property (2023: £1.25m property).
The majority of the properties owned are freehold except for 11 properties which are long leasehold; eight of these are under a minimum of 999-year leases at a peppercorn rent and the remaining three are under 125-year leases at a peppercorn rent.
Change in fair value of investment properties
The following elements are included in the change in fair value of investment properties reported in the consolidated financial statements:
| | Year ended | Year ended |
| | 31 December | 31 December |
| | 2024 | 2023 |
| | £'000 | £'000 |
| Revaluation movement | 18,227 | 21,934 |
| Rental lease incentive1 | (1,592) | 140 |
| Rental income arising from recognising rental premiums and guaranteed rent uplifts | (7,173) | (7,286) |
| Change in fair value of investment properties | 9,462 | 14,788 |
1. Lease incentives relate to the amortisation of payments made to tenants that are not part of any acquisition contractual obligations. These payments are made in return for a variation to the rent.
Rental income arising from recognising guaranteed rent uplifts and initial lease rental payment includes the adjustments to rental receipts for the period to reflect the total minimum income recognised over the expected lease terms on a straight-line basis. Rent premiums received are being reflected on a straight-line basis over the term of the lease. In addition, the Group benefits from a minimum annual rental uplift of 1% or 2% on the majority of leases. These uplifts are also incorporated to recognise income on a straight-line basis. The elements are reported in the table below. Capital improvements funded by the Group are undertaken under Deeds of Variation to the leases. The period between signing the Deed of Variation and rent commencing is a rent-free period and rent is recognised on a straight-line basis from the signing of the Deed of Variation.
| | | Year ended | Year ended |
| | | 31 December | 31 December |
| | | 2024 | 2023 |
| | Note | £'000 | £'000 |
| Rent received in advance of recognition1 | 5 | 78 | 140 |
| Rent recognised in advance of receipt2 | 5 | 7,095 | 7,146 |
| Rental income arising from recognising rental premium and future guaranteed rent uplifts | | 7,173 | 7,286 |
1. Rent premiums received in prior periods as well as any rent premiums received during the year, deemed to be a premium over the term of the lease.
2. Relates to both rent-free periods being recognised on a straight-line basis over the term of the lease and rent recognised in the period to reflect the minimum 1% or 2% uplift in rents over the term of the lease on a straight‑line basis.
Descriptions and definitions relating to valuation techniques and key unobservable inputs made in determining fair values are as follows:
Valuation techniques used to derive fair values
The valuations have been prepared on the basis of fair value which is defined in the RICS "Red Book" as the "price that would be received to sell an asset or paid to transfer a liability in an orderly transaction between market participants at the measurement date" in accordance with IFRS 13. The concept of fair value is considered to be consistent with that of market value. The valuation takes into consideration the current market conditions including improvements effected during the year, annual rentals, lease lengths, property condition, rent coverage and location.
Unobservable inputs
These include: estimated average increase in rent based on both market estimations and contractual situations; equivalent yield (defined as the weighted average of the net initial yield and reversionary yield); estimated rental value (ERV) based on market conditions prevailing at the valuation date; and the physical condition of the property determined by inspections on a rotational basis. A decrease in the ERV would decrease fair value. A decrease in the equivalent yield would increase the fair value. An increase in the remaining lease term would increase the fair value.
Sensitivity of measurement of significant unobservable inputs
| | Year ended | Year ended |
| | 31 December | 31 December |
| | 2024 | 2023 |
| Significant unobservable inputs |
| |
| Initial yield ranges | 2.3% - 15.5% | 3.5% - 12.5% |
| EPRA topped-up net initial yield | 6.96% | 6.92% |
| Annual rent roll | £49.2m | £47.2m |
| ERV | £50.2m | £48.2m |
| ERV per bed ranges | £2,600/bed | £2,300/bed |
| | to £13,000/bed | to £12,000/bed |
| Sensitivity to a 0.25% movement in valuation yield |
| |
| Change in investment property valuation | £23.5m | £22.6m |
| Sensitivity to a 1% movement in rental income |
| |
| Change in investment property valuation | £6.8m | £6.5m |
Fair value hierarchy
The Group is required to classify fair value measurements of its investment properties using a fair value hierarchy, in accordance with IFRS 13: Fair Value Measurement. This hierarchy reflects the subjectivity of the inputs used, and has the following levels:
· Level 1 - unadjusted quoted prices in active markets;
· Level 2 - observable inputs other than quoted prices included within level 1; and
· Level 3 - unobservable inputs.
The following table provides the fair value measurement hierarchy for investment property:
| | Date of valuation | Total £'000 | Level 1 £'000 | Level 2 £'000 | Level 3 £'000 |
| Assets measured at fair value: |
|
|
|
|
|
| Investment properties | 31 December | | | | |
| | 2024 | 630,788 | - | - | 630,788 |
| Assets held-for-sale | 31 December | | | | |
| | 2024 | 4,175 | - | - | 4,175 |
| Investment properties | 31 December | | | | |
| | 2023 | 616,006 | - | - | 616,006 |
There have been no transfers between any of the levels during the year.
Accounting policy
Investment properties
Investment properties consist of land and buildings (principally care homes) which are held to earn rental income and for capital growth potential.
Investment properties are initially recognised at cost, being the fair value of consideration given, including transaction costs associated with the investment property. Investment properties are recognised when the risk and rewards on the acquired properties pass to the Group on completion of the purchase. Any subsequent capital expenditure incurred in improving investment properties is capitalised in the period incurred and included within the book cost of the property.
After initial recognition, investment properties are measured at fair value, with gains and losses recognised in the consolidated statement of comprehensive income in the period in which they arise. Fair value measurement takes into consideration the improvements to the investment property during the year taking into account the future cash flows from increases in rent that have been contracted in relation to the improvement and discounting them at an appropriate rate to reflect the percentage of completion of the works being undertaken and the risk to completion that remains.
Gains and losses on disposals of investment properties are determined as the difference between net disposal proceeds and the carrying value of the asset. These are recognised in the consolidated statement of comprehensive income in the period in which they arise.
14. Assets held-for-sale
During the year the Group exchanged contracts for sale on three properties. As this highly probably sale had not completed at year end, these assets were transferred from investment property to assets held‑for-sale.
| | As at | As at |
| | 31 December | 31 December |
| | 2024 | 2023 |
| | £'000 | £'000 |
| |
| |
| Opening value | - | - |
| Transfer from investment property | 4,175 | - |
| Assets held-for-sale | 4,175 | - |
Accounting policy
Assets held-for-sale
If management have committed to a plan to sell an investment property, the asset is being actively marketed at a reasonable price and its sale is highly probable within the following 12 months, this asset transfers from investment property to assets held-for-sale.
Investment properties are carried at fair value before being initially classified as held-for-sale. After being transferred to assets held-for-sale, the investment property continues to be carried at fair value.
15. Trade and other receivables
| | As at | As at |
| | 31 December | 31 December |
| | 2024 | 2023 |
| | £'000 | £'000 |
| Non-current |
| |
| Rent recognised in advance of receipt | 42,353 | 35,258 |
| Rental lease incentive | 3,971 | 2,379 |
| Loan receivable1,2 | 5,187 | 1,600 |
| | 51,511 | 39,237 |
| Current |
| |
| Interest receivable on interest rate derivatives | 277 | 358 |
| Interest receivable on operator loan | 10 | 66 |
| Accrued income | - | 142 |
| Prepayments | 32 | 196 |
| Other receivables | 246 | 145 |
| | 565 | 907 |
| | 52,076 | 40,144 |
1. In November 2024, the Group entered into a loan agreement with Prestige, in which the Group provided £5m. The funds were lent to Prestige to develop a new home. Upon certain conditions being met, a put and call option for the Group to acquire the development for an additional payment of £3.7m is exercisable. If these options aren't exercised the loan becomes repayable in June 2026 with interest of 7.7%.
2. In June 2023, the Group entered into a loan agreement with Melrose Holdings Limited, a related party, where the Group provided a working capital loan of £1.6m. On transfer of the leases to third-party operators, We Care and Fulcrum, during 2024, £1.4m of this balance was recognised as a lease incentive as part of the lease negotiations with the incoming tenants. There is an outstanding working capital facility with Fulcrum of up to £450,000 which bears interest at 10% per annum on drawn amounts; £187,000 was drawn at the year end.
No impairment losses have been recognised as at 31 December 2024 (2023: £nil), refer to note 20 for further detail.
Accounting policy
Trade and other receivables
Trade receivables comprise mainly lease income receivable.
Trade and other receivables are initially recognised at fair value plus transaction costs and subsequently measured at amortised cost less impairment.
The Group applies the amortised cost basis as trade and other receivables are normally held with an objective to collect contractual cash flows, i.e. "held to collect"; which comprises payment of principal and interest on the principal amount outstanding.
16. Cash and cash equivalents
| | As at | As at |
| | 31 December | 31 December |
| | 2024 | 2023 |
| | £'000 | £'000 |
| Cash and cash equivalents | 10,492 | 9,389 |
None of the Group's cash balances are held in restricted accounts. £1.0m of cash and cash equivalents as at 31 December 2024 relates to rental deposits, see note 17.
Accounting policy
Cash and cash equivalents
Cash and cash equivalents include cash at bank and deposits with maturities of three months or less, held at call with banks.
17. Trade and other payables
| | As at | As at |
| | 31 December | 31 December |
| | 2024 | 2023 |
| | £'000 | £'000 |
| Non-current |
| |
| Rent received in advance of recognition | 2,251 | 2,330 |
| Rental deposits1 | 1,009 | - |
| | 3,260 | 2,330 |
| Current |
| |
| Trade and other payables | 1,528 | 1,686 |
| Interest payable | 2,006 | 1,745 |
| Withholding tax payable - (PID dividends) | 628 | 606 |
| Rental received in advance | 80 | - |
| Capital improvements payable | 2,649 | 2,878 |
| | 6,891 | 6,915 |
| | 10,151 | 9,245 |
1. In accordance with the terms of certain lease agreements, a rent deposit can be payable when tenant profitability exceeds a defined level.
To reconcile working capital changes in the consolidated statement of cash flows, the interest payable and capital improvements payable movements are excluded, as these are allocated to financing activities and investing activities respectively.
Accounting policy
Trade payables
Trade payables are initially recognised at their fair value and are subsequently measured at amortised cost.
18. Borrowings
A summary of the bank borrowings drawn in the period is shown below:
| | As at | As at |
| | 31 December | 31 December |
| | 2024 | 2023 |
| | £'000 | £'000 |
| At the beginning of the year | 184,760 | 142,260 |
| Borrowings drawn in the year | 44,000 | 82,500 |
| Borrowings repaid in the year | (31,000) | (40,000) |
| Total bank borrowings drawn | 197,760 | 184,760 |
As at 31 December 2024, the Group had £250m (2023: £250m) of available facilities, of which £52.2m was undrawn (2023: £65.2m).
A summary of the bank borrowings by lender is shown below:
As at 31 December 2024:
| | | | National | | | |
| | Clydesdale Bank PLC | HSBC UK Bank Plc | Westminster Bank Plc | Senior secured loan notes | Senior secured loan notes | |
| | ('Virgin') | ('HSBC') | ('NatWest') | (tranche A) | (tranche B) | Total |
| Facility type | RCF | RCF | RCF | Private | Private | |
| | | | | placement | placement | |
| Size (£m) | 50.0 | 75.0 | 50.0 | 37.0 | 38.0 | 250.0 |
| Drawn debt (£m) | 30.5 | 47.0 | 45.3 | 37.0 | 38.0 | 197.8 |
| Start date | December 2022 | April 2020 | June 2021 | December 2021 | December 2021 | |
| Expiry date | December 2029 | April 2026 | June 2029 | December 2035 | June 2035 | |
| Margin | 2.00% | 2.00% | 2.00% | N/A | N/A | |
| Fixed interest rate | N/A | N/A | N/A | 2.93% | 3.00% | |
| Independent valuation of secured properties (£m) | 126.1 | 175.4 | 135.4 | 175.3 | 612.2 | |
| Financial covenants: | | | | | | |
| LTV1 | 50% | 55% | 50% | 55% | | |
| Interest cover2 | 2.00x | 2.00x | 1.75x | 2.50x | | |
As at 31 December 2023:
| | | | National | | | |
| | Clydesdale Bank PLC | HSBC UK Bank Plc | Westminster Bank Plc | Senior secured loan notes | Senior secured loan notes | |
| | ('Virgin') | ('HSBC') | ('NatWest') | (tranche A) | (tranche B) | Total |
| Facility type | RCF | RCF | RCF | Private | Private | |
| | | | | placement | placement | |
| Size (£m) | 50.0 | 75.0 | 50.0 | 37.0 | 38.0 | 250.0 |
| Drawn debt (£m) | 32.5 | 47.0 | 30.3 | 37.0 | 38.0 | 184.8 |
| Start date | December 2022 | April 2020 | June 2021 | December 2021 | December 2021 | |
| Expiry date | December 2029 | April 2026 | June 2028 | December 2035 | June 2035 | |
| Margin | 2.00% | 2.00% | 2.00% | N/A | N/A | |
| Fixed interest rate | N/A | N/A | N/A | 2.93% | 3.00% | |
| Independent valuation of secured properties (£m) | 118.2 | 163.6 | 129.2 | 171.3 | 582.3 | |
| Financial covenants: | | | | | | |
| LTV1 | 50% | 55% | 50% | 55% | | |
| Interest cover2 | 2.00x | 2.00x | 1.75x | 2.50x | | |
1. Loan to value must not exceed the stated percentage.
2. Net rent from ringfenced properties divided by interest expense must exceed the stated cover ratio.
In September 2024, the Group agreed a one-year extension option to its NatWest RCF to June 2029. There is a further option to extend to June 2030, subject to lender approval, exercisable during 2025.
The Group has been in compliance with all of the financial covenants of the loan facilities as applicable throughout the year covered by these financial statements.
Any fees associated with arranging the borrowings unamortised as at the year end are offset against amounts drawn on the facilities as shown in the table below:
| | As at | As at |
| | 31 December | 31 December |
| | 2024 | 2023 |
| | £'000 | £'000 |
| Borrowings drawn | 197,760 | 184,760 |
| Arrangement fees - brought forward | (4,823) | (5,064) |
| Arrangement fees incurred during the year | (484) | (1,177) |
| Amortisation of loan arrangement fees | 955 | 1,418 |
| Borrowings at amortised cost | 193,408 | 179,937 |
Maturity analysis of borrowings:
| | As at | As at |
| | 31 December | 31 December |
| | 2024 | 2023 |
| | £'000 | £'000 |
| Repayable within one year | - | - |
| Repayable between one and two years | 47,000 | - |
| Repayable between two and five years | 75,760 | 77,260 |
| Repayable in over five years | 75,000 | 107,500 |
| Total | 197,760 | 184,760 |
The weighted average term of the Group's committed facilities (excluding extension options) is 5.5 years (2023: 6.8 years).
As at 31 December 2024, the nominal value of the Group's loans equated to £197.8m; the fair value of these loans, based on a discounted cash flow using relevant rates based on market conditions as at 31 December 2024, totalled £177.6m. This is categorised as level 2 in the fair value hierarchy (see note 13 for further detail of the hierarchy).
Accounting policy
Borrowings
All borrowings are initially recognised at fair value net of attributable transaction costs. After initial recognition, all borrowings are measured at amortised cost, using the effective interest method. The effective interest rate is calculated to include all associated transaction costs.
Fees paid on the establishment of loan facilities are recognised as transaction costs of the loan to the extent that it is probable that some or all of the facility will be drawn down. The fee is capitalised as a prepayment for liquidity services and amortised over the period of the facility to which it relates within finance costs in the consolidated statement of comprehensive income.
19. Interest rate derivatives
| | As at | As at |
| | 31 December | 31 December |
| | 2024 | 2023 |
| | £'000 | £'000 |
| At the beginning of the year | 1,750 | 363 |
| Purchase of derivative | - | 3,238 |
| Change in fair value of interest rate derivatives | 329 | (458) |
| Payments received and accrued on interest rate derivatives | (1,595) | (1,393) |
| | 484 | 1,750 |
To mitigate the interest rate risk that arises as a result of entering into variable rate linked loans, the Group has entered into interest rate caps.
In January 2023, the Group purchased a two-year interest rate cap for £1.5m, which caps SONIA at 3% for a notional amount of £50m. Following the year end, this interest rate cap was renewed at the same rate for an additional year, see note 29 for further detail.
In August 2023, the Group purchased a two-year interest rate cap for £1.8m, which caps SONIA at 4% for a notional amount of £50m.
At 31 December 2024, the Group had loans of £122.8m (2023: £109.8m) which were exposed to interest rate risk.
Accounting policy
Interest rate derivatives
Derivative financial instruments, comprising interest rate caps for hedging purposes, are recognised at fair value.
Changes in fair value of interest rate derivatives are recognised within the consolidated statement of comprehensive income in the period in which they occur.
The Group does not apply hedge accounting in accordance with IFRS 9.
20. Financial instruments and financial risk management
The Group's principal financial assets and liabilities are those that arise directly from its operations: trade and other receivables, trade and other payables and cash held at bank. The Group's other principal financial assets and liabilities are borrowings and interest rate derivatives, the main purpose of which is to finance the acquisition and development of the Group's investment property portfolio and hedge against the interest rate risk arising.
Set out below is a comparison by class of the carrying amounts of the Group's financial instruments:
| | As at | As at |
| | 31 December | 31 December |
| | 2024 | 2023 |
| | £'000 | £'000 |
| Financial assets at amortised cost: |
| |
| Loan receivable | 5,187 | 1,600 |
| Cash and cash equivalents | 10,492 | 9,389 |
| Trade and other receivables | 533 | 711 |
| Financial assets at fair value: |
| |
| Interest rate derivative | 484 | 1,750 |
| Financial liabilities at amortised cost: |
| |
| Borrowings | 193,408 | 179,937 |
| Trade and other payables | 7,192 | 6,309 |
The interest rate derivative and put option are the only financial instruments that are measured at fair value through the Group's consolidated statement of comprehensive income.
The following table provides the fair value measurement hierarchy for the interest rate derivative and put option:
| | Date of | Total | Level 11 | Level 21 | Level 31 |
| | valuation | £'000 | £'000 | £'000 | £'000 |
| Assets measured at fair value: | | | | | |
| Interest rate derivative | 31 December | | | | |
| | 2024 | 484 | - | 484 | - |
| Interest rate derivative | 31 December | | | | |
| | 2023 | 1,750 | - | 1,750 | - |
1. The fair value categories are defined in note 13.
Risk management
The Group is exposed to market risk (including interest rate risk), credit risk and liquidity risk. The board oversees the management of these risks. The board reviews and agrees policies for managing each of the risks that are summarised below.
Market risk (including interest rate risk)
Market risk is the risk that the fair values or future cash flows of financial instruments will fluctuate because of changes in market prices. The financial assets held by the Group that are affected by interest rate risk are principally the Group's cash balances and the interest rate derivative.
The Group monitors its interest rate exposure on a regular basis. A sensitivity analysis performed to ascertain the impact on profit or loss and net assets of a 50-basis point shift in interest rates on the Group's cash balances would result in a movement of £52,461 (2023: £46,945) in interest receivable for the year.
The financial liabilities held by the Group that are affected by interest rate risk are principally the Group's borrowings. The Group has entered into interest rate derivatives to reduce its exposure to interest rate risk on its floating-rate debt (refer to note 18). A sensitivity analysis performed to ascertain the impact on profit or loss and net assets of a 50-basis point shift in interest rates on the Group's unhedged borrowings would result in a movement of £113,800 (2023: £48,800) in interest payable for the year.
Credit risk
Credit risk is the risk that a counterparty will not meet its obligations under a financial instrument or customer contract, leading to a financial loss.
In 2024, the Group entered into a new loan agreement with Prestige Group, in which the Group provided a £5m term loan to fund Prestige Group's development of a new care home.
The loan is guaranteed by Prestige Group and the agreement stipulates that the funds can only be used for development costs, hence the value of the entity in which the money is loaned to, and the property developed, should have assets of at least £5m whether in cash or in a under-development home. This, along with reporting requirements to provide assurance of the value of the development, gives the Group comfort that there are no expected credit losses in association with this loan.
The Group is exposed to credit risks from its leasing activities and working capital loans to operators. Credit risk is reduced by requiring tenants to pay rentals in advance under their lease obligations. The credit quality of the tenant is also assessed based at the time of entering into a lease agreement, thereby reducing credit risk. Outstanding trade receivables are regularly monitored. There were no outstanding trade receivables and £0.2m in working capital loans to operators as at 31 December 2024.
Credit risk also arises with the cash balances held with banks and financial institutions. The board believes that the credit risk on current account cash balances is limited because the counterparties are reputable banks with high credit ratings assigned by international credit rating agencies. The impairment loss identified on cash balances was considered immaterial.
Accounting policy
Expected credit losses
The Group applies the IFRS 9 simplified approach to measuring the expected credit losses (ECLs) for trade receivables whereby the allowance or provision for all trade receivables is based on the lifetime ECLs.
The Group applies the general approach for initial recognition and subsequent measurement of ECL provisions for the loan receivable and other receivables which have maturities of 12 months or more and have a significant finance component.
This approach comprises of a three-stage approach to evaluating ECLs. These stages are classified as follows:
Stage one
12-month ECLs are recognised in profit or loss at initial recognition and a loss allowance is established. For financial instruments that have not deteriorated significantly in credit quality since initial recognition or that have low credit risk at the reporting date, the loss allowance for 12-month ECLs is maintained and updated for changes in amount. Interest revenue is calculated on the gross carrying amount of the asset (i.e. without reduction for ECLs).
Stage two
If the credit risk increases significantly and the resulting credit quality is not considered to be low credit risk, full lifetime ECLs are recognised and includes those financial instruments that do not have objective evidence of a credit loss event. Interest revenue is still calculated on the gross carrying amount of the asset.
Stage three
If the credit risk of a financial asset increases to the point that it is considered credit impaired (there is objective evidence of impairment at the reporting date), lifetime ECLs continue to be recognised. For financial assets in this stage, lifetime ECLs will generally be individually assessed. Interest revenue is calculated on the amortised cost net carrying amount (amortised cost less impairment).
Rent smoothing adjustments are not considered to be financial assets as the amounts are not yet contractually due. As such, the requirements of IFRS 9 (including the expected credit loss method) are not applied to those balances, although the credit risk is considered in the determination of the fair value of the related property.
Liquidity risk
Liquidity risk arises from the Group's management of working capital. It is the risk that the Group will encounter difficulty in meeting its financial obligations as they fall due, as the majority of the Group's assets are property investments and are therefore not readily realisable. The Group's objective is to ensure it has sufficient available funds for its operations and to fund its capital expenditure. This is achieved by regular monitoring of forecast and actual cash flows by the AIFM ensuring the Group has appropriate levels of cash and available drawings to meet liabilities as they fall due.
The table below summarises the maturity profile of the Group's financial liabilities based on contractual undiscounted payments:
| | <3 months | 3-12 months | 1-2 years | 2-5 years | >5 years | Total |
| | £'000 | £'000 | £'000 | £'000 | £'000 | £'000 |
| 31 December 2024: |
|
|
|
|
|
|
| Borrowings | - | - | 47,000 | 75,760 | 75,000 | 197,760 |
| Interest and commitment fees on borrowings | 927 | 2,853 | 3,293 | 8,017 | 12,718 | 27,808 |
| Trade and other payables | 6,183 | - | - | - | 1,009 | 7,192 |
| 31 December 2023: | | | | | | |
| Borrowings | - | - | - | 77,260 | 107,500 | 184,760 |
| Interest and commitment fees on borrowings | 937 | 2,853 | 3,790 | 9,318 | 15,382 | 32,280 |
| Trade and other payables | 6,309 | - | - | - | - | 6,309 |
21. Capital management
The objective of the Group is to acquire, own, lease, renovate, extend and redevelop high-quality healthcare real estate assets in the UK and lease those assets, under full repairing and insuring leases, primarily to healthcare operators providing residential healthcare services. This provides ordinary shareholders with an attractive level of income together with the potential for income and capital growth from investing in a diversified portfolio of freehold and long leasehold care homes.
The board has responsibility for ensuring the Group's ability to continue as a going concern and continues to qualify for UK REIT status. This involves the ability to borrow monies in the short and long term and pay dividends out of reserves, all of which are considered and approved by the board on a regular basis.
The Company achieved its increased targeted aggregate dividend of 6.95 pence per share for the year ended 31 December 2024 and its target aggregate dividend of 6.77 pence per share for the year ended 31 December 2023.
As at 31 December 2024, the Group remained within its maximum loan to value (LTV) covenant, which is 35% of gross asset value of the Group as a whole. The Group has a further £52.2m of RCF facilities available from which it can draw.
To maintain or adjust the capital structure, the Company may adjust the dividend payment to shareholders, return capital to shareholders, issue new shares or buy back shares for cancellation or for holding in treasury. Capital consists of ordinary share capital, other capital reserves and retained earnings.
22. Share capital, share premium and capital reduction reserve
| | Shares in issue Number | Share capital £'000 | Share premium £'000 | Capital reduction reserve £'000 | Total £'000 |
| As at 31 December 2022 | 404,764,328 | 4,048 | 365,642 | 24,077 | 393,767 |
| Share issue | 9,603,841 | 96 | 11,104 | - | 11,200 |
| Share issue cost | - | - | (30) | - | (30) |
| As at 31 December 2023 | 414,368,169 | 4,144 | 376,716 | 24,077 | 404,937 |
| As at 31 December 2024 | 414,368,169 | 4,144 | 376,716 | 24,077 | 404,937 |
The Company had 414,368,169 shares of nominal value of 1 pence each in issue at the end of the year (2023: 414,368,169).
Accounting policy
Share capital
The share capital relates to amounts subscribed for share capital at its par value.
Share premium
The surplus of net proceeds received from the issuance of new shares over their par value is credited to this account and the related issue costs are deducted from this account. The reserve is non-distributable.
Capital reduction reserve
The capital reduction reserve is the result of the transfer of a portion of share premium into a distributable reserve.
23. Transactions with related parties
Investment Manager
The fees calculated and paid for the year to the Investment Manager were as follows:
| | Year ended | Year ended |
| | 31 December | 31 December |
| | 2024 | 2023 |
| | £'000 | £'000 |
| Amounts payable to Impact Health Partners LLP |
| |
| Net fee | 5,022 | 4,810 |
| Gross fee | 5,022 | 4,810 |
For the year ended 31 December 2024, the principals and Finance Director of Impact Health Partners LLP, the Investment Manager, are considered key management personnel. Mr Patel and Mr Cowley are the principals and Mr Yaldron is the Finance Director of Impact Health Partners LLP and they own 2.60%, 0.39% and 0.06% respectively (either directly, with related parties or through a wholly owned company) of the total issued ordinary share capital of Care REIT plc. Mr Patel also (directly and/or indirectly) holds a majority 72.5% stake in Minster Care Group Limited (MCGL). Mr Cowley also holds a 20% interest in MCGL. 35.6% of the Group's rental income was received from MCGL or its subsidiaries. No trade receivables were outstanding at the year end (2023: £nil).
During the year the key management of Impact Health Partners LLP received the following dividends from Care REIT plc: Mahesh Patel £743,333 (2023: £722,610); Andrew Cowley £112,584 (2023: £109,445); and David Yaldron £13,236 (2023: £11,137).
Directors' interests
During the year the directors, who are considered key management personnel, received the following dividends from the Company: Simon Laffin £6,905 (2023: £5,078); Rosemary Boot £2,072 (2023: £2,014); Amanda Aldridge £1,381 (2023: £nil); Cedi Frederick £612 (2023: £nil); Chris Santer £976 (2023: £949); and Philip Hall (resigned) £1,029 (2023: £2,014).
Directors' remuneration for the year is disclosed in note 7 as well as in the directors' remuneration report.
Minster Care Group Limited (MCGL)
MCGL, a tenant of the Group, is considered a related party as it is majority owned by the principals of the Investment Manager. As at 31 December 2024, the Group leased 56 properties to MCGL (2023: 58); all properties owned for over one year underwent an inflation‑linked rent review in line with their lease provisions. In 2024, the Group extended the leases on five properties by ten years, entered into no new leases with MCGL (2023: no new leases), disposed of two properties to an affiliate of Minster and exchanged on the sale of three properties which was pending completion at the year end; these three properties were classified as assets held‑for‑sale (2023: disposed of one property). In 2024, the Group spent £7.6m on approved capital expenditure on seven homes operated by MCGL (2023: £nil). These transactions were fully compliant with the Company's related party policy.
During the year all seven homes operated by Melrose Holdings Limited (MHL), an entity wholly owned by connected parties of Mahesh Patel, were re-tenanted to third-party operators on new long-term leases. As at 31 December 2024, the Group had no further engagement and no outstanding assets, liabilities or obligations with MHL.
24. Net asset value (NAV) per share
Basic NAV per share is calculated by dividing net assets in the consolidated statement of financial position attributable to ordinary equity holders of the Company by the number of ordinary shares outstanding at the end of the year. As there are no dilutive instruments outstanding, basic and diluted NAV per share are identical.
The Group has chosen to adopt EPRA net tangible assets (EPRA NTA) as its primary EPRA NAV measure as it most closely aligns with the business practices of the Group. The adjustments between NAV and EPRA NTA are reflected in the following table:
| | As at | As at |
| | 31 December | 31 December |
| | 2024 | 2023 |
| | £'000 | £'000 |
| Net assets per consolidated statement of financial position | 494,456 | 478,107 |
| Fair value of derivatives | (484) | (1,750) |
| EPRA NTA | 493,972 | 476,357 |
| |
| |
| Issued share capital (number) | 414,368,169 | 414,368,169 |
| Basic NAV per share | 119.33p | 115.38p |
| EPRA NTA per share | 119.21p | 114.96p |
25. Operating leases
The following table sets out the maturity analysis of leases receivables, showing the undiscounted lease payments under non-cancellable operating leases receivable by the Group:
| | As at | As at |
| | 31 December | 31 December |
| | 2024 | 2023 |
| | £'000 | £'000 |
| Year one | 50,036 | 48,541 |
| Year two | 50,958 | 49,409 |
| Year three | 51,898 | 50,158 |
| Year four | 52,856 | 51,046 |
| Year five | 53,832 | 51,761 |
| Onwards | 984,049 | 986,920 |
| Total | 1,243,629 | 1,237,835 |
The Group's investment properties are leased to tenants under the terms of property leases that include upward-only rent reviews that are performed annually. These are annual inflation uplifts linked to either CPI or RPI. RPI-linked leases have a floor and cap at either 2% and 4% or 1% and 5%.
26. Reconciliation of liabilities to cash flows from financing activities
| | | | Interest rate | Interest | |
| | | Borrowings | derivative | payable | Total |
| | Notes | £'000 | £'000 | £'000 | £'000 |
| As at 1 January 2023 | | 137,196 | (363) | 1,149 | 137,982 |
| Cash flows from financing activities: | | | | | |
| Borrowings drawn | 18 | 82,500 | - | - | 82,500 |
| Borrowings repaid | 18 | (40,000) | - | - | (40,000) |
| Loan arrangement fees paid | | (2,827) | - | - | (2,827) |
| Interest received | 19 | - | 1,035 | - | 1,035 |
| Interest and commitment fees paid | | - | - | (9,518) | (9,518) |
| Purchase of interest rate derivatives | 19 | - | (3,238) | - | (3,238) |
| Non-cash movements: | | | | | |
| Amortisation of loan arrangement fees | 18 | 1,418 | - | - | 1,418 |
| Fair value movement | 19 | - | 458 | - | 458 |
| Loan arrangement fees - reversal of accrual | | 1,650 | - | - | 1,650 |
| Interest and commitment charge | | - | - | 10,114 | 10,114 |
| Accrued interest receivable on interest rate derivatives | | - | 358 | - | 358 |
| As at 31 December 2023 | | 179,937 | (1,750) | 1,745 | 179,932 |
| Cash flows from financing activities: | | | | | |
| Borrowings drawn | 18 | 44,000 | - | - | 44,000 |
| Borrowings repaid | 18 | (31,000) | - | - | (31,000) |
| Loan arrangement fees paid | | (714) | - | - | (714) |
| Interest received | 19 | - | 1,676 | - | 1,676 |
| Interest and commitment fees paid | | - | - | (10,441) | (10,441) |
| Non-cash movements: | | | | | |
| Amortisation of loan arrangement fees | 18 | 955 | - | - | 955 |
| Fair value movement | 19 | - | (329) | - | (329) |
| Loan arrangement fees - reversal of accrual | | 230 | - | - | 230 |
| Interest and commitment charge | | - | - | 10,702 | 10,702 |
| Accrued interest receivable on interest rate derivatives | | - | (81) | - | (81) |
| As at 31 December 2024 | | 193,408 | (484) | 2,006 | 194,930 |
27. Capital commitments
At 31 December 2024, the Group had loaned £5m to an existing operator for the development of a new home; on practical completion of this development the Group has an option to acquire this home for an additional payment of £3.7m. The Group also exchanged contracts to purchase one property for a purchase price of £3.8m; this had not completed at the year end. The Group had capital commitments in relation to the improvements to eight existing properties (2023: three); this amounted to £1.6m (2023: £9.5m).
The Group has committed to deferred payment agreements on three acquisitions (including the aforementioned exchanged transaction which had not completed at the year end) in return for increased rent based on certain trading performance conditions being met by the tenant. As at 31 December 2024, the total capital commitment for these deferred payments is estimated at £6.7m (2023: £4.6m).
28. Controlling parties
The Company is not aware of any person who, directly or indirectly, owns or controls the Company. The Company is not aware of any arrangements the operations of which may give rise to a change in control of the Company.
29. Subsequent events
In January 2025, the Group purchased a one-year interest rate cap for £0.7m, which caps SONIA at 3% for a notional amount of £50m.
As announced on 11 March 2025, the Company's directors have reached agreement on the terms of a recommended cash acquisition of the entire issued and to be issued ordinary share capital of the Company by CR United Bidco Ltd, a wholly-owned subsidiary of CareTrust REIT, Inc., expected to be effected by means of a Scheme of Arrangement under Part 26 of the Companies Act 2006 (the "Acquisition"). If the Acquisition is completed, this will result in a change of control of the Company. There are no agreements between the Company and the directors for compensation for loss of office as a result of the Acquisition or any other takeover, other than the provisions of the existing appointment letters.
No other significant events have occurred between the statement of financial position date and the date when the financial statements have been authorised by the directors, which would require adjustments to, or disclosure in, the financial statements.
Company statement of financial position
As at 31 December 2024
Company Registration Number: 10464966
| | | 31 December | 31 December |
| | | 2024 | 2023 |
| | Notes | £'000 | £'000 |
| Non-current assets | |
| |
| Investment in subsidiaries | 6 | 474,041 | 418,861 |
| Total non-current assets | | 474,041 | 418,861 |
| Current assets | |
| |
| Trade and other receivables | 7 | 36,360 | 60,994 |
| Cash and cash equivalents | 8 | 8,203 | 7,773 |
| Total current assets | | 44,563 | 68,767 |
| Total assets | | 518,604 | 487,628 |
| Current liabilities | |
| |
| Trade and other payables | 9 | (24,148) | (9,521) |
| Total liabilities | | (24,148) | (9,521) |
| Total net assets | | 494,456 | 478,107 |
| Equity | |
| |
| Share capital | 10 | 4,144 | 4,144 |
| Share premium reserve | 10 | 376,716 | 376,716 |
| Capital reduction reserve | 10 | 24,077 | 24,077 |
| Retained earnings | | 89,519 | 73,170 |
| Total equity | | 494,456 | 478,107 |
The Company has taken advantage of the exemption allowed under section 408 of the Companies Act 2006 and has not presented its own statement of comprehensive income in these financial statements. The profit attributable to the Parent Company for the year ended 31 December 2024 amounted to £44,961,000 (2023: profit of £57,247,000).
The financial statements were approved and authorised for issue by the board of directors on 12 March 2025 and are signed on its behalf by:
Simon Laffin
Chair
The accompanying notes form an integral part of these financial statements.
Company statement of changes in equity
For the year ended 31 December 2024
| | Notes | Share capital £'000 | Share premium £'000 | Capital reduction reserve £'000 | Retained earnings £'000 | Total £'000 |
| 1 January 2024 | | 4,144 | 376,716 | 24,077 | 73,170 | 478,107 |
| Total comprehensive income | | - | - | - | 44,961 | 44,961 |
| Transactions with owners | | | | | | |
| Dividends paid | 5 | - | - | - | (28,612) | (28,612) |
| 31 December 2024 |
| 4,144 | 376,716 | 24,077 | 89,519 | 494,456 |
For the year ended 31 December 2023
| | Notes | Share capital £'000 | Share premium £'000 | Capital reduction reserve £'000 | Retained earnings £'000 | Total £'000 |
| 1 January 2023 | | 4,048 | 365,642 | 24,077 | 43,737 | 437,504 |
| Total comprehensive income | | - | - | - | 57,247 | 57,247 |
| Transactions with owners | | | | | | |
| Dividends paid | 5 | - | - | - | (27,814) | (27,814) |
| Share issue | 10 | 96 | 11,104 | - | - | 11,200 |
| Share issue costs | 10 | - | (30) | - | - | (30) |
| 31 December 2023 | | 4,144 | 376,716 | 24,077 | 73,170 | 478,107 |
The accompanying notes form an integral part of these financial statements.
Notes to the Company financial statements
For the year ended 31 December 2024
1. Basis of preparation
General information
The financial statements for the year ended 31 December 2024 are prepared in accordance with Financial Reporting Standard 102, the Financial Reporting Standard applicable in the United Kingdom and the Republic of Ireland ('FRS 102') and in accordance with the Companies Act 2006, with comparatives presented for the year ended 31 December 2023.
Disclosure exemptions adopted
In preparing these financial statements the Company has taken advantage of all disclosure exemptions conferred by FRS 102.
In preparing the separate financial statements of the Company, advantage has been taken of the following disclosure exemptions available in FRS 102:
· a reconciliation of the number of shares outstanding at the beginning and end of the period has not been presented as the reconciliations of the Group and the Company would be identical;
· no statement of cash flows has been presented for the Company;
· disclosures in respect of the Company's financial instruments have not been presented as equivalent disclosures have been provided in respect of the Group as a whole;
· the requirement to present related party disclosures between the Company and fellow subsidiaries where ownership is all 100%; and
· no disclosures have been given for the aggregate remuneration of the key management personnel of the Company as their remuneration is included in the totals for the Group as a whole.
Convention
The financial statements are presented in Sterling, which is also the Company's functional currency, and all values are rounded to the nearest thousand (£'000), except when otherwise indicated.
Going concern
After making enquiries and bearing in mind the nature of the Company's business and assets, the directors consider that the Company has adequate resources to continue in operational existence for the next 15 months from the date of approval of these financial statements. For this reason, they continue to adopt the going concern basis in preparing the financial statements.
The ongoing effect of inflated costs and the high-interest rate environment has been considered by the directors. The directors have reviewed the forecasts for the Company taking into account the impact of heightened interest rates and costs on trading over the 15 months from the date of signing this annual report. The forecasts have been assessed against a range of possible downside outcomes incorporating significantly lower levels of income and higher costs. The expiry of one of the Group's revolving credit facilities in April 2026 has been considered by the directors in the extended 15-month going concern review period; see going concern and viability for further detail.
The directors believe that there are currently no material uncertainties in relation to the Company's ability to continue for a period of at least 15 months from the date of approval of the Company's financial statements. The board is, therefore, of the opinion that the going concern basis adopted in the preparation of the annual report is appropriate.
2. Significant accounting judgements, estimates and assumptions
The preparation of the Company's financial statements requires management to make judgements, estimates and assumptions that affect the reported amounts recognised in the financial statements and disclosures. However, uncertainty about these assumptions and estimates could result in outcomes that could require material adjustment to the carrying amount of the assets or liabilities in future periods.
The most significant estimates, assumptions and judgements relate to the determination of carrying value of unlisted investments in the Company's subsidiary undertakings. The nature, facts and circumstance of the investment are taken into account in assessing whether there are any indications of impairment.
3. Summary of material accounting policies
The principal accounting policies applied in the preparation of these financial statements are set out alongside the relevant note.
4. Taxation
The Company is exempt from corporation tax on the profits and gains from its property investment business, provided it continues to meet certain conditions as per REIT regulations. Any non-qualifying profits and gains, however, will continue to be subject to corporation tax.
Tax charge included in total comprehensive income:
| | Year ended | Year ended |
| | 31 December | 31 December |
| | 2024 | 2023 |
| | £'000 | £'000 |
| UK corporation tax | - | - |
5. Dividends
Details of dividends paid by the Company are included in note 12 to the consolidated financial statements.
During 2023, the Company received a dividend in the amount of £54,388,000 from one of its wholly owned subsidiaries, Impact Property 6 Limited, £51,693,000 of which was declared in the absence of adequate distributable reserves. Impact Property 6 Limited has taken the required steps to regularise this dividend and has created adequate distributable reserves during the year, by way of a cancellation of its non-distributable share premium reserve and the creation of a distributable capital reduction reserve.
Accounting policy
Dividends
Dividends are recognised when they become legally payable.
6. Investment in subsidiaries
| | 31 December | 31 December |
| | 2024 | 2023 |
| | £'000 | £'000 |
| At the beginning of the year | 418,861 | 430,079 |
| Additions | 80,373 | 165,234 |
| Impairment | (25,193) | (176,452) |
| At the end of the year | 474,041 | 418,861 |
Provisions provided reflect any reduction in net asset value of subsidiaries in the year, typically as a result of dividends declared in the year. The net assets of the subsidiaries are effected by the same estimates of the Group's investment property portfolio. Additions are primarily a result of capital injections from the Company into its direct subsidiaries via the subsidiaries' issuance of new share capital.
The Company has the following subsidiaries:
| | Principal activity | Country of incorporation | Ownership % |
| Impact Property 1 Limited ('Propco 1')1 | Real estate investment | England and Wales | 100 |
| Impact Property 2 Limited ('Propco 2')1 | Real estate investment | England and Wales | 100 |
| Impact Property 3 Limited ('Propco 3')1 | Real estate investment | England and Wales | 100 |
| Impact Property 4 Limited ('Propco 4')1 | Real estate investment | England and Wales | 100 |
| Impact Property 5 Limited ('Propco 5') | Real estate investment | England and Wales | 100 |
| Impact Property 6 Limited ('Propco 6') | Real estate investment | England and Wales | 100 |
| Impact Property 7 Limited ('Propco 7')1 | Real estate investment | England and Wales | 100 |
| Impact Property 8 Limited ('Propco 8')1 | Real estate investment | England and Wales | 100 |
| Impact Finance 1 Limited ('Finance 1')1 | Financing company | England and Wales | 100 |
| Impact Finance 2 Limited ('Finance 2')1 | Financing company | England and Wales | 100 |
| Impact Finance 3 Limited ('Finance 3')1 | Financing company | England and Wales | 100 |
| Impact Finance 4 Limited ('Finance 4')1 | Financing company | England and Wales | 100 |
| Impact Finance 5 Limited ('Finance 5')1 | Financing company | England and Wales | 100 |
| Impact Holdco 1 Limited ('Holdco 1') | Investment holding company | England and Wales | 100 |
| Impact Holdco 2 Limited ('Holdco 2') | Investment holding company | England and Wales | 100 |
| Impact Holdco 3 Limited ('Holdco 3') | Investment holding company | England and Wales | 100 |
| Impact Holdco 4 Limited ('Holdco 4') | Investment holding company | England and Wales | 100 |
| Impact Holdco 5 Limited ('Holdco 5') | Investment holding company | England and Wales | 100 |
| The Holmes Care Holdings Limited1,2 | Property holding company | England and Wales | 100 |
| Tower Bridge Homes Care Limited1,2 | Property holding company | England and Wales | 100 |
| The Holmes Care Group GB Limited1,2 | Property holding company | England and Wales | 100 |
| Romney Care Home Limited1,2 | Property holding company | England and Wales | 100 |
| Hillcrest House Limited1,2 | Property holding company | England and Wales | 100 |
| Carlton Hall (Lowestoft) Limited1,2 | Property holding company | England and Wales | 100 |
| Abingdon Manor Care Centre Limited1,2 | Property holding company | Northern Ireland | 100 |
| Larne Care Centre Limited1,2 | Property holding company | Northern Ireland | 100 |
| Larne C C Limited1,2 | Property holding company | Northern Ireland | 100 |
| Butterfly Cumbria Properties Limited1,2 | Property holding company | England and Wales | 100 |
| Welford Bidco 5 Midco Limited1,2 | Investment holding company | England and Wales | 100 |
| Morris Care Limited1,2 | Property holding company | England and Wales | 100 |
| Kingdom Finco 1 Limited1,2 | Investment holding company | England and Wales | 100 |
| Kingdom Homes Limited1,2 | Property holding company | Scotland | 100 |
| Barrogil Limited1,2 | Property holding company | Scotland | 100 |
| Eastleigh Care Group Limited1,2 | Property holding company | England and Wales | 100 |
| Woodleigh Christian Care Home Limited1 | Property holding company | England and Wales | 100 |
| Welford Bidco 2 Midco Limited1,2 | Investment holding company | England and Wales | 100 |
| Welford Bidco 4 Midco Limited1,2 | Investment holding company | England and Wales | 100 |
2. As at 31 December 2024 these entities were held indirectly by the Company.
3. As at 31 December 2024 these entities are in the process of winding up.
The registered address for the above subsidiaries incorporated in England and Wales is:
The Scalpel, 18th Floor, 52 Lime Street, London EC3M 7AF, England
The registered address for the above subsidiaries incorporated in Northern Ireland is:
21 Arthur Street, Belfast, BT1 4GA, Northern Ireland
The registered address for the above subsidiaries incorporated in Scotland is:
177 Bothwell Street, Glasgow, G2 7ER, Scotland
Where the entity is in the process of winding up, the registered address is that of the liquidator appointed by the Company.
Accounting policy
Investments in subsidiaries
The investments in subsidiary companies are included in the Company's statement of financial position at cost less provision for impairment.
7. Trade and other receivables
| | As at | As at |
| | 31 December | 31 December |
| | 2024 | 2023 |
| | £'000 | £'000 |
| Loan to Group companies | 36,046 | 60,797 |
| Prepayments | 314 | 197 |
| | 36,360 | 60,994 |
As at 31 December 2024, there were no trade receivables past due or impaired (2023: none). Loans to subsidiaries are interest-free, repayable on demand and management expect them to be settled within the next 12 months.
Accounting policy
Trade and other receivables
Trade and other receivables are recognised and carried at the lower of their original invoiced value and recoverable amount. Where the time value of money is material, receivables are initially recognised at fair value and subsequently measured at amortised cost. A provision for impairment is made when there is objective evidence that the Company will not be able to recover balances in full.
Balances are written off when the probability of recovery is assessed as being remote.
8. Cash and cash equivalents
| | As at | As at |
| | 31 December | 31 December |
| | 2024 | 2023 |
| | £'000 | £'000 |
| Cash and cash equivalents | 8,203 | 7,773 |
None of the Company's cash balances are held in restricted accounts.
Accounting policy
Cash and cash equivalents
Cash and cash equivalents include cash at bank and deposits with maturities of three months or less, held at call with banks.
9. Trade and other payables
| | As at | As at |
| | 31 December | 31 December |
| | 2024 | 2023 |
| | £'000 | £'000 |
| Loan from Group companies | 22,525 | 7,781 |
| Trade and other payables | 995 | 1,134 |
| Withholding tax payable - (PID dividends) | 628 | 606 |
| | 24,148 | 9,521 |
Loans from Group companies are unsecured, interest-free and are repayable on demand.
Accounting policy
Trade and other payables
Trade payables are initially recognised at their fair value and are subsequently measured at cost.
10. Share capital, share premium and capital reduction reserve
Details on movements in share capital, share premium and capital reduction reserve of the Company are the same as that of the Group and are included in note 22 to the consolidated financial statements.
Accounting policy
Share capital
The share capital relates to amounts subscribed for share capital at its par value.
Share premium
The surplus of net proceeds received from the issuance of new shares over their par value is credited to this account and the related issue costs are deducted from this account. The reserve is non-distributable.
Capital reduction reserve
The capital reduction reserve is the result of the transfer of a portion of the share premium into a distributable reserve.
11. Transactions with related parties
The Company has taken advantage of the exemption provided by FRS 102 not to disclose transactions with other members of the Group as the Company's own financial statements are presented together with its consolidated financial statements.
See note 23 of the consolidated financial statements for disclosure of related party transactions of the Group.
12. Capital commitments
There were no capital commitments held by the Company (2023: £nil).
13. Contingent liabilities
On 21 December 2021, the Company guaranteed a long-term loan note issue made by a wholly owned subsidiary. The loan notes total £75m and mature in 2035. See note 18 of the consolidated financial statements for further detail.
14. Subsequent events
Significant events after the reporting period are the same as those of the Group. See note 29 to the consolidated financial statements.
No other significant events have occurred between the statement of financial position date and the date when the financial statements have been authorised by the directors, which would require adjustments to, or disclosure in, the financial statements.
Additional information
Reporting against the Task Force on Climate-Related Financial Disclosures framework
In this report we disclose the climate-related risks and opportunities and our overarching approach to the risk management in line with the recommendations of the TCFD. As is referenced throughout the report, we have continued to take action to improve the environmental performance of our portfolio and the IM works in partnership with tenants to help them reduce their energy consumption and CO2e emissions. We have fully reported our Scope 3 emissions, which represents the bulk of our emissions and have already exceeded our 2025 target for EPC improvement across our portfolio.
Although our like-for-like CO2 emissions have declined in 2024, we are aware that our target of a 15% decrease from our 2022 baseline by 2025 is unlikely to be met. The assumptions we made about the UK grid in the shorter term may have been too ambitious when our pathway was modelled, but the current plans from the Department for Energy Security and Net Zero, combined with the development and affordability of energy-efficient and renewable technologies, should support our decarbonisation efforts in the medium term.
Building on the work we undertook in 2023, where we considered a 1.5-2 degrees warming scenario, based on the Intergovernmental Panel on Climate Change's (IPCC) defined Representative Concentration Pathway 2.6 and assessed the associated physical and transition risks, the IM has undertaken more granular analysis on flood risk across our portfolio based on Environment Agency data.
Our IM's ESG committee, established in 2023, met on a quarterly basis and continues to provide us with a structure through which to embed our strategy, track our progress and ensure that the necessary discussions and decisions take place at the board level.
The IM has also started considering IFRS S1 and S2 and the UK government's Transition Pathway Taskforce framework to ensure that we are heading in the right direction in terms of future reporting.
TCFD compliance statement
The table below highlights how we have reported in line with the 11 recommendations of TCFD and includes our own assessment of our level of compliance. We recognise that this is an iterative process and have highlighted those areas where we still need to make improvement or continue to progress.
|
Recommended disclosure |
Current status |
|
| Governance |
|
|
| Describe the board's oversight of | Reporting in line with the recommendations.
| We have included these disclosures in the report |
| Describe management's role in assessing and managing climate‑related risks and opportunities | Reporting in line with the recommendations.
| We have included these disclosures in the report |
| Strategy |
|
|
| Describe the climate-related risks and opportunities the organisation has identified over the short, medium and long term | Reporting in line with the recommendations.
| We have included these disclosures in this report, please see previous annual reports for further detail |
| Describe the impact of climate‑related risks and opportunities on the organisation's businesses, strategy and financial planning | We have made disclosures but are not yet fully reporting in line with the recommendations.
| We have assessed the impacts of climate-related risks and opportunities from a qualitative perspective but have yet to translate this fully into quantifiable financial impacts. This will continue to be reviewed during 2025 |
| Describe the resilience of the organisation's strategy, taking into consideration different climate-related scenarios, including a 2°C or lower scenario | We have made disclosures but are not yet fully reporting in line with the recommendations.
| We consider ourselves resilient to transition risks associated with 1.5-2 degrees warming scenarios. Flooding and heatwaves are our main two physical risks and we continue to gain insight to understand the specific risks and impacts at each of our locations |
| Risk management |
|
|
| Describe the organisation's processes for identifying and assessing climate‑related risks | Reporting in line with the recommendations.
| We have included these disclosures in the report |
| Describe the organisation's processes for managing climate-related risks | Reporting in line with the recommendations.
| We have included these disclosures in the report |
| Describe how processes for identifying, assessing and managing climate‑related risks are integrated into the organisation's overall risk management | Reporting in line with the recommendations. | We have included these disclosures in the report |
| Metrics and targets |
|
|
| Disclose the metrics used by the organisation to assess climate-related risks and opportunities in line with its strategy and risk management processes | Reporting in line with the recommendations.
| We have included these disclosures in the report |
| Describe Scope 1, Scope 2 and, if appropriate, Scope 3 greenhouse gas (GHG) emissions, and the related risks | Reporting in line with the recommendations.
| We continue to improve the accuracy of our reported Scope 3 emissions, which represents a significant proportion of our total emissions. We now collect over 93% of Scope 3 emissions data from our tenants (2023: 85%) and continue to explore ways to improve the quality and quantity of this data capture and disclosure
|
| Describe the targets used by the organisation to manage climate‑related risks and opportunities and performance against targets | We have made disclosures but are not yet fully reporting in line with the recommendations.
| We have set ourselves targets on CO2 emissions and EPC ratings across our portfolio. Performance is reviewed annually |
Governance
In 2023 the Investment Manager's ESG committee, with associated terms of reference, was established. It meets on a quarterly basis and documents minutes and actions, is responsible for reviewing and advising on the recommendations made by the IM's ESG working group, also established in 2023, chaired by the IM's Development Director.
The ESG committee is chaired by the IM's Finance Director who, in partnership with the Development Director, oversees the operational and financial aspects of our sustainability programme and reports directly into the board and consults with the audit committee around assurance matters. ESG/sustainability is a regular item on the board agenda.
We have updated our ESG policy, reinforcing our commitment to working with our tenants to become energy efficient. Energy efficiency, renewables and physical climate risks, principally flooding, are regular agenda items in the IM's quarterly reviews with our tenants.
More information on our governance of climate change considerations can be found within our reporting on principal risks and our "How we manage risk" section.
| Board |
| |
| Overall accountability for ESG strategy, targets and monitoring deliverables | | |
| ^ | < | |
| Audit committee | ESG committee |
|
| Identification and management of climate risks | Review and advise on climate strategy | |
| ^ | <^ | < |
| Risk committee | ESG working group | TCFD working group |
| Identification and management of climate risks | Accountability for execution of Sustainability/ESG strategy | Initial assessment of risks and opportunities linked to climate change |
Key:
Board level
Investment Manager
Strategy
The IM has continued to make good progress in terms of ensuring that the necessary improvements are being made to our properties to ensure that they comply with future MEES regulation.
As our tenants are responsible for procuring energy for heating and power, we are not directly able to implement energy efficiency measures. However, the IM can continue to engage with all tenants to raise awareness, for example by holding an ESG webinar and including sustainability as a standing agenda item in regular review meetings.
The IM continues to model the energy usage and carbon emissions from our portfolio, and this enables them to identify underperforming assets and assess short and long-term options for reducing consumption and emissions. When undertaking asset management projects, improving the environmental sustainability of the asset is a key deliverable. During 2024, projects have included fabric upgrades, solar panels and air source heat pumps.
The IM has an energy efficiency engagement plan in place with our tenants which is leading to greater collaboration on initiatives such as the development of solar PV roll-out across properties where it is commercially viable.
We are conscious that flooding remains a risk for our business in the short, medium and longer term, be that as an acute or chronic physical risk. During the year we experienced two flood events during periods of exceptional rainfall. The most serious of these events was at a home which was at high risk of flooding and where we had previously invested in flood defences which did not operate effectively due to accidental intervention. The IM is investigating what additional physical and operational measures are required to improve the home's resilience.
Risk management
Climate change is integrated and clearly articulated across our principal risks, specifically within "Underinvestment in care homes" and "Reputational damage".
The Investment Management team has a risk committee which assesses and reviews the Company's risk register on a quarterly basis and reports to the audit committee. Prioritised risks are discussed and considered by the audit committee and board twice a year.
As part of the due diligence process for potential new acquisitions, environmental performance has already been assessed on all acquisitions since 2020. This includes a review of the asset's, current and potential energy efficiency CRREM stranding risk, and, where required, a pathway towards achieving an EPC of B or above. We also review other climate-related risks such as exposure to flooding.
Looking ahead, this due diligence will continue to factor in possible identified risks and opportunities associated with climate change and a decarbonisation pathway.
To align with our business strategy, we have defined short term as one to three years, medium term as five to ten years (aligned to our business plan and various climate‑related targets) and a long-term timeframe as up to 25 years (new lease length aligned to longer-term transition planning objectives).
Extreme weather/flood
Probability: Medium
Impact: Moderate
Change in the year: Slight increase
Risk tolerance: Cautious
Timescale: Short/Medium/Long
Disruption to provision of care or possible closure of care home
How we are assessing the risk
The IM has reviewed Environment Agency (EA) data for all care homes within the portfolio. 12 assets have been identified as potentially at risk of flooding. The IM has also reviewed data from our insurers, who have identified six assets where an excess applies in the event of a claim for flood damage. The IM has engaged with tenants to ensure that they have flood resilience protocols in place and will review if any further measures are required.
How we manage this risk
All our homes are fully insured against damage, including loss of rent. Our tenants separately have business interruption and contents insurance, for the losses to their own business. In addition, we benefit from the size of our operators' businesses and profits should this insurance be insufficient. Where flood risk has been identified, or occurred, the IM works with our tenants and insurers to enhance the flood defences and safety for residents.
During the year we had two flood events; in both cases our losses have been fully recoverable. In relation to the flood at Old Prebendal House, which was extensive, our operator's business interruption insurance is not expected to fully cover the cost; however, the broader operator business is capable of absorbing these losses.
Opportunity
Increased investment in our homes and capital deployed in return for increased rent.
Improved resilience of assets from physical risks.
Additional capital expenditure
Probability: High
Impact: Moderate
Change in the year: No change
Risk tolerance: Cautious
Timescale: Medium/Long
Additional costs required to improve energy efficiency and realise net zero targets
How we are assessing the risk
The IM has mapped and estimated a capex profile from the present day until 2045, when we plan to be net zero. We are targeting approximately 15% of asset management budget towards energy‑efficiency improvements. We are not on track to meet our 2025 targets so additional capex may be required to catch up on our energy and carbon reduction target.
The IM has also assessed all 57 assets with EPCs of C or below (English equivalent) to understand how these can be improved to a B or above. Of these clear pathways have been developed for all except 14, which we believe will require a transition away from their current energy source to a fully electric supply such as air source heat pumps.
How we manage this risk
Our leases with our tenants are fully insuring and repairing and require tenants to ensure the property is compliant with legislation. Therefore, as legislation comes in to align with these targets, our tenants will be responsible for the cost and could factor this into the cost of their services.
The IM is working with our tenants to ensure our buildings are well prepared for future legislation and our ESG targets. They do this by having a good understanding of the environmental performance of our homes We also ensure that any capital improvements that require our permission include environmental enhancements.
Opportunity
Increased investment in our homes and capital deployed in return for increased rent.
Ability to utilise improvements in technology to help reduce the carbon footprint of our portfolio.
Improved long-term care of residents.
Regulation
Probability: High
Impact: Moderate
Change in the year: No change
Risk tolerance: Cautious
Timescale: Medium/Long
Potential loss of value for assets not meeting expected future standards. Assets may become "stranded" by evolving environmental legislation
How we are assessing the risk
The IM works closely with environmental consultants to help understand future potential for any changes in regulation and the IM appraises our portfolio against these possible regulations.
The IM uses the CRREM tool to risk assess our current and prospective assets to understand the pathway needed to reach net zero in accordance with the Paris climate treaty. We are working with our tenants to develop a transition plan to reduce energy consumption and mitigate climate change impacts.
Our approach is that no asset with an EPC below C can be acquired unless a demonstrable EPC improvement plan is developed, the cost of which is reflected in the investment case for the asset acquisition. Opportunities for the installation of energy efficiency and renewable technology in support of the net zero transition (such as rooftop solar PV and EV charging) are also considered as part of the investment case.
We now have full visibility of EPCs across our entire portfolio of properties and the IM has an active asset management improvements schedule in place to ensure we are compliant with anticipated 2030 MEES regulation. Our leases require our tenant operators to ensure the buildings are in compliance with legislation.
How we manage this risk
As explained above, our leases require our tenant operators to ensure the buildings are following legislation.
Opportunity
Increased investment in our homes and capital deployed in return for increased rent.
Ability to utilise improvements in technology to help reduce the carbon footprint of our portfolio.
Cost of carbon
Probability: Medium
Impact: Moderate
Change in the year: No change
Risk tolerance: Cautious
Timescale: Medium
Introduction of carbon levy by the government to encourage reduction in carbon emissions that results in additional taxation liability for the Company
How we are assessing the risk
The IM has held two workshops to discuss the possible options regarding carbon pricing/taxation and how or whether to introduce this into our business strategy and financial planning.
The IM continues to ensure they are capturing as much underlying data from our tenants on our Scope 3 emissions. This means that the effect of different carbon pricing levels and approaches can be modelled.
We will continue to monitor the situation in 2025 and ensure that we are compliant with future financial and sustainability disclosure requirements. We will start to embed an internal carbon price within our planning to inform decision-making.
How we manage this risk
By understanding the legislation being applied in other countries the IM can model similar legislation being applied in the UK and ensure this can be incorporated into our risk modelling in 2025.
Opportunity
None identified.
Market
Probability: Medium
Impact: Moderate
Change in the year: No change
Risk tolerance: Cautious
Timescale: Medium
Investors and markets have increasing their awareness of environmental performance. If we fail to communicate a strategy and implications for our portfolio, investors are less likely to want to invest in our business
How we are assessing the risk
As explained throughout our reporting against the TCFD framework, the IM is undertaking a significant amount of work to ensure we can deliver against our net zero objective and 2030 interim milestones and we communicate the risks and opportunities that come with this.
We regularly engage with investors and ensure we are open and transparent about our business in our reporting to ensure we understand any investor concerns and address these.
How we manage this risk
Alongside investor engagement we have already achieved EPRA Gold for our sustainability reporting and have made submissions to GRESB and achieving a D rating with the Carbon Disclosure Project.
The Investment Manager is a signatory to the UN Principles for Responsible Investment, demonstrating its commitment to long‑term stewardship of the portfolio.
Opportunity
By taking our environmental targets seriously and transparent reporting, more investors could be interested in investing in our business.
Reputation
Probability: Medium
Impact: Moderate
Change in the year: No change
Risk tolerance: Minimalist
Timescale: Short
Investors, tenants and commissioners may have increasing expectations of real estate owners for environmental issues and if we fail to meet these or deliver against our commitments our reputation would be damaged and stakeholders less willing to engage with us
How we are assessing the risk
We regularly engage with stakeholders to understand their expectations and aspirations regarding climate risk and environmental sustainability. Our tenant survey specifically references energy efficiency and how we, as a long-term landlord, can assist tenants in meeting their own objectives for reducing energy and carbon.
How we manage this risk
By engaging with our stakeholders, we can seek to align our environment objectives or use our influence to raise awareness of climate change risk. We seek to be transparent and open about our environmental targets and activities to demonstrate our commitment to improving environmental performance on a commercial sustainable basis for ourselves and our tenants.
Opportunity
If we are successful in communicating and delivering against these targets, existing stakeholders will want to continue to work with us and, potentially, more will be keen to work with us.
Metrics and targets
As part of our EPRA reporting responsibilities, we have been disclosing our energy consumption data since 2019 in accordance with the EPRA Best Practice Sustainability Requirements. Our Scope 1 and 2 emissions are minimal, with all reported emissions relating to tenant-obtained energy consumption falling under Scope 3. In this report we have included our GHG emissions for the 12 months to 30 September 2024.
We have already exceeded our 2025 target of having at least 50% of our care homes rated EPC B or better.
Our key climate-related metrics are:
· EPC ratings
· Energy intensity per bed (kWh per bed)
· GHG emissions intensity (CO2e per bed)
· Capex deployed on sustainability improvements (£pa)
· Interim net zero targets
· Proportion of leases with "Green" obligations
We measure performance on a range of metrics for our Scope 3 emissions (tenant-procured energy) and the IM's Scope 1 and 2 emissions.
| | | |
| 2023 | |
| Performance measure | Unit | Scope | 2024 | adjusted | Change |
| Electricity absolute consumption | kWh | 3 | 18,423 | 21,000 | (12)% |
| Electricity total and like-for-like consumption | kWh | 3 | 18,423 | 18,776 | (2)% |
| Gas absolute consumption | kWh | 3 | 53,154 | 58,974 | (10)% |
| Gas total and like-for-like consumption | kWh | 3 | 53,154 | 55,365 | (4)% |
| Other fuels absolute consumption1 | kWh | 3 | 7,072 | 5,235 | 35% |
| Other fuels like-for-like consumption1 | kWh | 3 | 7,072 | 5,105 | 39% |
| Building energy intensity absolute1 | kWh/bed/year | 3 | 10,850 | 11,036 | (2)% |
| Building energy intensity like-for-like1 | kWh/bed/year | 3 | 10,850 | 10,932 | (1)% |
| Building energy intensity like-for-like | kWh/m2/year | 3 | 284 | 289 | (2)% |
| Total indirect greenhouse gas (GHG) emissions from tenant-obtained fuel usage | tCO2e | 3 | 14,143 | 15,568 | (9)% |
| Total indirect greenhouse gas (GHG) emissions from tenant-obtained fuel usage like-for-like1 | tCO2e | 3 | 14,143 | 14,413 | (2)% |
| Greenhouse gas (GHG) emissions intensity from building energy consumption | tCO2e/bed/year | 3 | 1.95 | 2.02 | (3)% |
| Total indirect greenhouse gas (GHG) emissions from tenant-obtained fuel usage | kg CO2e/m2/year | 3 | 51 | 53 | (4)% |
| Greenhouse gas (GHG) emissions intensity from building energy consumption like-for-like1 | tCO2e/bed/year | 3 | 1.95 | 1.99 | (2)% |
| Total indirect greenhouse gas (GHG) emissions from tenant-obtained fuel usage like for like | kg CO2e/m2/year | 3 | 51 | 53 | (3)% |
| Performance measure | Unit | Scope | 2024 | 2023 | Change |
| Total electricity consumption | kWh | Total Investment Manager electricity | 7,100 | 7,336 | (3)% |
| Investment Manager energy intensity | kWh/FTE | Average kWh electricity consumption per FTE in year | 710 | 733 | (5)% |
| Total indirect greenhouse gas (GHG) emissions | tCO2e | Indirect - Scope 2 (location-based) | 1.4 | 1.5 | (7)% |
| Business travel - Land - Car | tCO2e | Scope 3 - Private vehicles (incl. WTT2) | 4.5 | 4.0 | 13% |
| Business travel - Land - Air | tCO2e | Scope 3 - Flights (with raw fuel incl. WTT3) | 4.1 | 1.7 | 141% |
| Business travel - Land - Rail | tCO2e | Scope 3 - Rail (incl. WTT3) | 0.2 | 0.2 | - |
| Total emissions | tCO2e | | 9.9 | 7.4 | 38% |
1. Like-for-like figures adjusted to exclude seven homes in Q4 2022 to Q3 2023 for which data was not available in the corresponding period Q4 2023 to Q3 2024.
2. Well-to-tank (WTT) business travel - air conversion factors are used to account for the upstream Scope 3 emissions associated with extraction, refining and transportation of the aviation fuel to the plane before take-off.
3. Well-to-tank (WTT) conversion factors for passenger vehicles and business travel on land are used to report the upstream Scope 3 emissions associated with extraction, refining and transportation of the raw fuels before they are used to power the transport mode.
4. Time period adjusted from calendar year to October to September to allow for availability of data from tenants.
EPRA performance measures (unaudited)
The table below shows additional performance measures, calculated in accordance with the Best Practices Recommendations of the European Public Real Estate Association (EPRA). We provide these measures to aid comparison with other European real estate businesses.
1. EPRA earnings per share1
| £36.8m |
| 8.89p per share for the year to 31 December 2024 |
| 2024 | 8.89p |
| 2023 | 8.67p |
| 2022 | 8.40p |
| 2021 | 8.05p |
Definition
Earnings from operational activities. The EPRA calculation removes revaluation movements in the investment portfolio and interest rate derivatives, but includes rent smoothing.
Purpose
A key measure of a company's underlying operating results is an indication of the extent to which current dividend payments are supported by earnings.
1. The comparative EPRA earnings have been restated in line with updated guidance from EPRA released in 2024 revising the calculation to include cash income received on interest rate derivatives.
2.1 EPRA net reinstatement value (NRV)
| £538.2m |
| 129.90p per share as at 31 December 2024 (as at 31 December 2023: £518.8m/125.20p per share) |
| 2024 | 129.90p |
| 2023 | 125.20p |
| 2022 | 118.51p |
| 2021 | 120.84p |
Definition
Net asset value adjusted for fair value of derivatives and transaction costs under the assumption they will not crystallise if the company never sells assets.
Purpose
The aim of this measure is to represent the value required to rebuild the entity.
2.2 EPRA net tangible assets (NTA)
| £494.0m |
| 119.21p per share as at 31 December 2024 (as at 31 December 2023: £476.4m/114.96p per share)
|
| 2024 | 119.21p |
| 2023 | 114.96p |
| 2022 | 110.08p |
| 2021 | 112.41p |
Definition
Net asset value adjusted for fair value of derivatives as these will not crystallise if held to maturity.
Purpose
This represents the value of the company assuming assets are bought and sold.
2.3 EPRA net disposal value
(NDV)
| £510.3m |
| 123.15p per share as at 31 December 2024 (as at 31 December 2023: £496.3m/119.77p per share) |
| 2024 | 123.15p |
| 2023 | 119.77p |
| 2022 | 108.92p |
| 2021 | 111.16p |
Definition
Net asset value adjusted to align borrowings to their fair value. It should be noted that this should not be viewed as a "liquidation NAV" because, in many cases, such as with the fair value adjustment to borrowings, fair values do not represent liquidation values. In the case of our borrowings, in a liquidation scenario we would not benefit from the fair value adjustment to reduce our borrowings.
Purpose
This measure aims to show the shareholders' value, should assets and liabilities not be held to maturity.
3.1 EPRA net initial yield (NIY)
| 6.79% |
| as at 31 December 2024 (as at 31 December 2023: 6.69%) |
| 2024 | 6.79% |
| 2023 | 6.69% |
| 2022 | 6.98% |
| 2021 | 6.71% |
Definition
Annualised rental income based on the cash rents passing at the balance sheet date, less non-recoverable property operating expenses, divided by the market value of the property, increased with (estimated) purchasers' costs.
Purpose
This measure should make it easier for investors to judge for themselves how the valuation of one portfolio compares with another portfolio.
3.2 EPRA "topped-up" NIY
| 6.96% |
| as at 31 December 2024 (as at 31 December 2023: 6.92%)
|
| 2024 | 6.96% |
| 2023 | 6.92% |
| 2022 | 6.98% |
| 2021 | 6.71% |
Definition
This measure adjusts the EPRA NIY in respect of the expiration of rent‑free periods (or other unexpired lease incentives, such as discounted rent periods and step rents).
Purpose
This measure should make it easier for investors to judge for themselves how the valuation of one portfolio compares with another portfolio.
4. EPRA vacancy rate
| 0.00% |
| as at 31 December 2024 (as at 31 December 2023: 0.00%)
|
| 2024 | 0.00% |
| 2023 | 0.00% |
| 2022 | 0.00% |
| 2021 | 0.00% |
Definition
Estimated market rental value (ERV) of vacant space divided by the ERV of the whole portfolio.
Purpose
A "pure" (%) measure of investment property space that is vacant, based on ERV.
5. EPRA cost ratio
| 13.81% |
| for the year to 31 December 2024 (2023: 14.37%)
|
| 2024 | 13.81% |
| 2023 | 14.37% |
| 2022 | 16.59% |
| 2021 | 15.84% |
Definition
Administrative and operating costs (including, and excluding, direct vacancy costs) divided by gross rental income.
Purpose
A key measure to enable meaningful measurement of the changes in a company's operating costs.
6. Like-for-like rental growth
| 6.32% |
| for the year to 31 December 2024 (2023: 4.67%) |
| 2024 | 6.32% |
| 2023 | 4.67% |
| 2022 | 5.07% |
| 2021 | 5.74% |
Definition
Rental growth on the portfolio of properties that have been owned and operational for two full reporting cycles.
Purpose
Growth of rental income excludes acquisitions and disposals, but includes increases in rent from inflationary uplifts and rentalised capital expenditure. This allows stakeholders to estimate the organic income growth.
7. EPRA (net) LTV
| 28.42% |
| As at 31 December 2024
|
| 2024 | 28.42% |
| 2023 | 27.85% |
| 2022 | 24.10% |
| 2021 | 23.17% |
Definition
Debt drawn at nominal value net of cash and net payables divided by portfolio value.
Purpose
To assess the gearing of the shareholder equity within a real estate company.
Notes to the EPRA performance measures (unaudited)
For the year ended 31 December 2024
1. EPRA earnings per share
| | 31 December | 31 December |
| | 2024 | 20231 |
| | £'000 | £'000 |
| Total comprehensive income (attributable to shareholders) | 44,961 | 48,831 |
| Adjusted for: |
| |
| - Revaluation movement | (18,227) | (21,934) |
| - Rental lease incentives | 1,592 | (140) |
| - Rental income arising from recognising rental premiums and future guaranteed rent uplifts | 7,173 | 7,286 |
| Change in fair value of investment properties | (9,462) | (14,788) |
| Change in fair value of put option | - | - |
| Loss on disposal of investment property | 20 | 16 |
| Interest received on interest rate cap | 1,595 | 1,393 |
| Change in fair value of interest rate derivatives | (329) | 458 |
| EPRA earnings | 36,785 | 35,910 |
|
|
| |
| Weighted average number of ordinary shares (basic and diluted) | 414,368,169 | 414,157,674 |
| EPRA earnings per share - basic and diluted | 8.89p | 8.67p |
1. 2023 has been restated to reflect the new guidelines regarding the calculation of EPRA earnings and EPRA earnings per share released by EPRA in 2024.
2. EPRA NAV measures
The Group has adopted EPRA NTA as its primary EPRA NAV measure as it most closely aligns with the Group's business practices.
As at 31 December 2024:
| | EPRA NRV | EPRA NTA | EPRA NDV |
| | £'000 | £'000 | £'000 |
| |
|
|
|
| Net assets at end of year | 494,456 | 494,456 | 494,456 |
| Exclude: |
|
|
|
| Fair value of derivatives | (484) | (484) | - |
| Include: |
|
|
|
| Fair value of debt1 | - | - | 15,851 |
| Transaction costs2 | 44,273 | - | - |
| Net assets (per EPRA measure) | 538,244 | 493,972 | 510,307 |
| Shares in issue at 31 December |
|
|
|
| (basic and diluted) | 414,368,169 | 414,368,169 | 414,368,169 |
| Net assets per share (per EPRA measure) | 129.90p | 119.21p | 123.15p |
As at 31 December 2023:
| | | | EPRA NDV |
| | EPRA NRV | EPRA NTA | (restated) |
| | £'000 | £'000 | £'000 |
| Net assets at end of year | 478,107 | 478,107 | 478,107 |
| Exclude: | | | |
| Fair value of derivatives | (1,750) | (1,750) | - |
| Include: | | | |
| Fair value of debt1 | - | - | 18,177 |
| Transaction costs2 | 42,452 | - | - |
| Net assets (per EPRA measure) | 518,809 | 476,357 | 496,284 |
| Shares in issue at 31 December | | | |
| (basic and diluted) | 414,368,169 | 414,368,169 | 414,368,169 |
| Net assets per share (per EPRA measure) | 125.21p | 114.96p | 119.77p |
1. Difference between interest-bearing loans and borrowings included in the balance sheet at amortised cost, and fair value of interest-bearing loans and borrowings at drawn amount.
2. NTA and NDV are calculated using property values in line with IFRS, where values are net of real estate transfer tax and other purchasers' costs. These transaction costs are added back for NRV.
3. EPRA net initial yield (NIY) and EPRA "topped-up" NIY
| | 31 December | 31 December |
| | 2024 | 2023 |
| | £'000 | £'000 |
| Investment property - wholly owned | 679,036 | 651,313 |
| Less capital improvements under construction | (14,161) | (9,669) |
| Completed property portfolio | 664,875 | 641,644 |
| Allowance for estimated purchasers' cost1 | 41,887 | 40,424 |
| Gross up completed property portfolio valuation (B) | 706,762 | 682,068 |
| Annualised cash passing rental income | 47,991 | 45,601 |
| Property outgoings (non-recoverable insurance) | - | - |
| Annualised net rents (A) | 47,991 | 45,601 |
| Add: |
| |
| Contractual rent on properties with interim variable rents whilst in turnaround | 1,227 | 1,617 |
| Topped-up net annualised rent (C) | 49,218 | 47,218 |
| EPRA net initial yield (A/B) | 6.79% | 6.69% |
| EPRA topped-up net initial yield (C/B) | 6.96% | 6.92% |
1. Assumes a purchaser of the Company's portfolio would pay SDLT and transaction costs equal to 6.5% of the portfolio's value.
4. EPRA vacancy rate
| | 31 December | 31 December |
| | 2024 | 2023 |
| | £'000 | £'000 |
| Estimated rental value of vacant space | - | - |
| Estimated rental value of the whole portfolio | 50,202 | 48,154 |
| EPRA vacancy rate | 0.00% | 0.00% |
5. EPRA cost ratio
| | 31 December | 31 December |
| | 2024 | 2023 |
| | £'000 | £'000 |
| Administrative and other expenses | 7,476 | 7,137 |
| Net service charge cost | - | - |
| Total costs including and excluding vacant property costs | 7,476 | 7,137 |
| Gross rental income | 54,146 | 49,659 |
| Total EPRA cost ratio (including, and excluding, direct vacancy costs) | 13.81% | 14.37% |
None of the costs in this note have been capitalised. Only costs directly associated with the purchase of properties as well as subsequent value-enhancing capital expenditure qualify as acquisition costs and are capitalised.
6. Like-for-like rental growth
This note shows the rental income and market value for property assets that have been owned and operational for two full reporting periods, hence all the below information relates to the property portfolio that has been owned and operational since 31 December 2022. It therefore excludes any rental increases or values in relation to properties acquired after 31 December 2022. Six properties whose leases were modified upon re-tenanting during this period have not been included as they do not reflect a stabilised operational lease across this period.
| | Rent | Market value |
| | £'000 | £'000 |
| Property portfolio as at 31 December 2022 | 36,793 | 508,306 |
| Inflation-linked rental uplifts | 1,537 | |
| Rental uplifts in return for capital improvements | | |
| or deferred payments | 162 | |
| Increase/(decrease) due to vacancy rate | - | |
| Property portfolio as at 31 December 2023 | 38,492 | 533,860 |
| Inflation-linked rental uplifts | 1,436 | |
| Rental uplifts in return for capital improvements | | |
| or deferred payments | 995 | |
| Increase/(decrease) due to vacancy rate | - | |
| Property portfolio as at 31 December 2024 | 40,923 | 565,380 |
All properties operate within the same sector, UK healthcare.
7. EPRA (net) LTV
| | 31 December | 31 December |
| | 2024 | 2023 |
| | £'000 | £'000 |
| Gross debt | 197,760 | 184,760 |
| Include: |
| |
| Net payables | 7,149 | 6,009 |
| Less: |
| |
| Cash and cash equivalents | (10,492) | (9,389) |
| EPRA net debt | 194,417 | 181,380 |
| Investment properties at fair value | 679,036 | 651,313 |
| Financial assets | 5,000 | - |
| Total property value | 684,036 | 651,313 |
| EPRA (net) LTV | 28.42% | 27.85% |
Alternative performance measures (unaudited)
The other alternative performance measures may not be comparable with similarly titled measures presented by other companies. Alternative performance measures should not be viewed in isolation but as supplementary information.
1. Total expense ratio (TER)
Total recurring administration costs as a percentage of average NAV throughout the period.
| | Year ended | Year ended |
| | 31 December | 31 December |
| | 2024 | 2023 |
| | £'000 | £'000 |
| Opening NAV | 478,107 | 445,920 |
| Closing NAV | 494,456 | 478,107 |
| Average NAV for the year | 486,281 | 462,013 |
| Administrative expenses | 7,476 | 7,137 |
| One-off costs | - | - |
| Recurring expenses | 7,476 | 7,137 |
| TER | 1.54% | 1.54% |
2. Total accounting return
The growth in NAV per share plus dividends paid expressed as a percentage of NAV per share at the beginning of the period.
| | Year ended | Year ended |
| | 31 December | 31 December |
| | 2024 | 2023 |
| Opening NAV per share (pence) | 115.38 | 110.17 |
| Closing NAV per share (pence) | 119.33 | 115.38 |
| NAV growth for the year (pence) | 3.95 | 5.21 |
| Dividends per share paid in the year (pence) | 6.91 | 6.71 |
| Total return (pence) | 10.86 | 11.92 |
| Total accounting return | 9.41% | 10.82% |
3. Gross loan to value (LTV)
The gross debt as a percentage of our gross asset value.
| | As at | As at |
| | 31 December | 31 December |
| | 2024 | 2023 |
| | £'000 | £'000 |
| Gross debt | 197,760 | 184,760 |
| Gross assets | 698,015 | 667,289 |
| LTV | 28.33% | 27.69% |
4. Property investments
This relates to the portfolio valuation along with investments via loans to operators for the acquisition of property portfolios.
| | As at | As at |
| | 31 December | 31 December |
| | 2024 | 2023 |
| | £'000 | £'000 |
| Investment property valuation | 674,861 | 651,313 |
| Assets held-for-sale | 4,175 | - |
| Property investments | 679,036 | 651,313 |
Our portfolio (unaudited)
At 31 December 2024, the Group owned the homes listed in the table below:
| Tenant and home | Region | Acquisition date1 | Beds2 | Capital projects3 |
| Belmont Healthcare | | | | |
| Madeira Lodge | South East | Nov 2023 | 48 | |
| Wombwell Hall | South East | Nov 2023 | 120 | |
| Value at 31 December 2024: £17.0m | ||||
| Careport | | | | |
| Briardene | North East | Aug 2018 | 60 | |
| Derwent | North East | Aug 2018 | 45 | |
| Holly Lodge | North East | Nov 2018 | 41 | |
| Kingston Court | North West | Jun 2019 | 80 | |
| Old Prebendal House and Court | South East | Jun 2019 | 40 | |
| Riverwell Beck | North West | Dec 2020 | 60 | |
| Sovereign Court and Lodge4 | North East | Aug 2018 | 60 | |
| The Grove | North East | Sep 2018 | 57 | |
| Value at 31 December 2024: £37.9m |
| |||
| Carlton Hall | | | | |
| Carlton Hall | East of England | Sep 2021 | 86 | |
| Oasis Development Site | East of England | Sep 2021 | - | |
| Value at 31 December 2024: £14.2m | ||||
| Croftwood Care* | | | | |
| Ancliffe | North West | | 40 | |
| Astbury Lodge | North West | | 41 | |
| Croftwood | North West | | 47 | |
| Crossways | North West | | 39 | |
| Elm House | North West | | 40 | +18 |
| Florence Grogan | North West | | 40 | |
| Garswood | North West | | 53 | |
| Gleavewood | North West | | 32 | |
| Golborne House | North West | | 45 | |
| Greenacres | North West | | 40 | |
| Hourigan | North West | | 40 | |
| Ingersley Court | North West | | 46 | |
| Lakelands | North West | | 40 | |
| Leycester House | North West | | 40 | +5 |
| Loxley Hall | North West | | 40 | |
| Lyndhurst | North West | | 40 | |
| New Milton House | North West | | 39 | |
| Parklands | North West | | 40 | |
| The Cedars | North West | | 27 | |
| The Elms | North West | | 41 | |
| The Hawthorns | North West | | 39 | |
| The Laurels | North West | | 40 | |
| Thorley House | North West | | 40 | |
| Turnpike Court | North West | | 53 | +8 |
| Wealstone | North West | | 42 | |
| Westhaven | North West | | 52 | |
| Whetstone Hey | North West | | 42 | |
| Woodlands Court | North West | | 40 | |
| Value at 31 December 2024: £83.4m | ||||
| Electus Care | | | | |
| Abingdon Manor | Northern Ireland | Feb 2023 | 60 | |
| Cedarhurst Lodge | Northern Ireland | Dec 2020 | 67 | |
| Edgewater Lodge | Northern Ireland | Dec 2020 | 75 | |
| Larne | Northern Ireland | Feb 2023 | 87 | |
| Saintfield Lodge | Northern Ireland | Dec 2020 | 51 | |
| Value at 31 December 2024: £23.9m | ||||
| Fulcrum Care | | | | |
| Baillieston | Scotland | Aug 2022 | 60 | |
| Cardonald | Scotland | Aug 2022 | 31 | |
| Springhill | Scotland | Nov 2021 | 61 | |
| Stobhill | Scotland | Aug 2022 | 60 | |
| Value at 31 December 2024: £10.2m | ||||
| Holmes Care Group | | | | |
| Alexander House | Scotland | Dec 2021 | 40 | |
| Almond Court | Scotland | Aug 2020 | 42 | |
| Almond View | Scotland | Aug 2020 | 78 | |
| Bankview (& BVDC) | Scotland | Aug 2020 | 65 | |
| Barrogil House | Scotland | Dec 2021 | 40 | |
| Beechwood | Scotland | Aug 2020 | 90 | |
| Camilla | Scotland | Dec 2021 | 40 | |
| Craigie House | Scotland | Dec 2021 | 30 | |
| Cragielea | Scotland | Aug 2020 | 85 | |
| Fernlea House | Scotland | Dec 2021 | 36 | |
| Finavon Court | Scotland | Dec 2021 | 24 | |
| Grandholm | Scotland | Aug 2020 | 79 | |
| Heatherfield | Scotland | Aug 2020 | 60 | |
| Larkfield | Scotland | Aug 2020 | 90 | |
| Lomond View | Scotland | Dec 2021 | 50 | |
| Methven House | Scotland | Dec 2021 | 60 | |
| Preston House | Scotland | Dec 2021 | 60 | |
| Roselea House | Scotland | Dec 2021 | 20 | |
| Three Towns | Scotland | Aug 2020 | 60 | |
| Walton House | Scotland | Dec 2021 | 40 | |
| Willow House | Scotland | Dec 2021 | 40 | |
| Value at 31 December 2024: £93.8m | ||||
| Maria Mallaband and Countrywide Group (MMCG) |
| |||
| Belmont House | Yorkshire & The Humber | May 2019 | 106 | |
| Croft House | Yorkshire & The Humber | Mar 2020 | 68 | |
| Howgate House | Yorkshire & The Humber | Mar 2020 | 63 | |
| Manor Park | Yorkshire & The Humber | Mar 2020 | 75 | |
| Parksprings | Scotland | May 2019 | 96 | |
| Thorntree Mews | Scotland | May 2019 | 40 | |
| Wallace View | Scotland | May 2019 | 60 | |
| Value at 31 December 2024: £35.5m |
| |||
| Minster Care* |
|
|
|
|
| Abbeywell | West Midlands | | 45 | |
| Amberley | South West | | 30 | +7 |
| Ashgrove5 | Yorkshire & The Humber | | 56 | |
| Broadgate | East Midlands | | 40 | |
| Carnbroe | Scotland | May 2018 | 76 | |
| Craigend | Scotland | | 48 | |
| Diamond House | East Midlands | | 74 | |
| Duncote Hall | East Midlands | | 40 | +1 |
| Duncote, The Lakes | East Midlands | | 47 | |
| Emmanuel5 | Yorkshire & The Humber | | 44 | |
| Falcon House | East Midlands | | 46 | |
| Freeland House | South East | | 111 | |
| Gray's Court | East of England | | 87 | |
| Grenville | East of England | May 2018 | 64 | |
| Hamshaw Court5 | Yorkshire & The Humber | | 45 | |
| Hillcrest | South West | Nov 2021 | 88 | |
| Ideal | West Midlands | | 50 | |
| Karam Court | West Midlands | | 47 | |
| Littleport Grange | East of England | | 80 | |
| Meadows & Haywain | East of England | | 65 | |
| Mowbray | West Midlands | | 39 | |
| Red Hill | West Midlands | Jan 2020 | 90 | |
| Rydal | North East | | 60 | |
| Saffron | East Midlands | Jun 2017 | 48 | |
| Sovereign House | West Midlands | | 60 | |
| Three Elms | North West | | 60 | |
| Waterside | West Midlands | | 47 | |
| Wordsley | West Midlands | | 44 | |
| Value at 31 December 2024: £136.1m | ||||
| NCUH NHS Trust |
|
|
|
|
| Reiver House | North West | Jun 2019 | - | |
| Surgical Unit | North West | Jun 2019 | - | |
| Value at 31 December 2024: £5.8m | ||||
| Optima | | | | |
| Barham | East of England | Aug 2019 | 44 | |
| Baylham | East of England | Aug 2019 | 55 | |
| Value at 31 December 2024: £16.1m | ||||
| Prestige Group | | | | |
| Merlin Manor Care Centre | North East | Mar 2020 | 94 | |
| Parkville | North East | Mar 2018 | 94 | |
| Roseville | North East | Mar 2018 | 103 | |
| Sandbanks | North East | Oct 2018 | 77 | |
| Yew Tree | North East | Jan 2019 | 101 | |
| Value at 31 December 2024: £38.8m |
|
| ||
| Renaissance Care | | | | |
| Croftbank | Scotland | Nov 2018 | 68 | |
| Rosepark | Scotland | Nov 2018 | 60 | |
| Value at 31 December 2024: £13.5m |
| |||
| We Care |
|
|
|
|
| Laurel Bank | Yorkshire & The Humber | Mar 2020 | 63 | |
| The Beeches | Yorkshire & The Humber | Mar 2020 | 60 | |
| Willow Bank | Yorkshire & The Humber | Mar 2020 | 59 | |
| Value at 31 December 2024: £6.0m |
| |||
| Welford | | | | |
| Argentum Lodge | South West | Sep 2019 | 56 | |
| Baily House | East Midlands | Jun 2023 | 66 | |
| Birchlands | Yorkshire & The Humber | Jun 2019 | 54 | +2 |
| Corbrook Park | North West | Jan 2024 | 80 | |
| Eastleigh - East Street & Rossiter House | South West | May 2023 | 54 | |
| Eastleigh - Periton Road | South West | May 2023 | 69 | |
| Eastleigh - Raleigh Mead | South West | May 2023 | 62 | |
| Fairview Court and House | South West | Mar 2018 | 81 | |
| Isle Court | West Midlands | Jan 2024 | 82 | |
| Mavern House | South West | Jan 2021 | 55 | |
| Morris Care Centre | West Midlands | Jan 2024 | 96 | |
| Oldbury Grange | West Midlands | Jan 2024 | 69 | |
| Radbrook | West Midlands | Jan 2024 | 63 | |
| Stretton Hall | West Midlands | Jan 2024 | 50 | |
| St Peter's House | East of England | Dec 2020 | 66 | |
| Vale View Heights Care Home | South West | Jun 2019 | 55 | |
| Woodleigh Christian Care Home | East Midlands | Jun 2023 | 44 | |
| Value at 31 December 2024: £146.8m | ||||
2. May 2017 unless stated.
3. Number of registered beds.
4. Capital improvement bed additions under development.
5. Treated as two properties.
6. Assets held-for-sale at year end.
* Croftwood Care and Minster Care are both part of Minster Care Group Limited.
AIFM statement (unaudited)
Impact Health Partners LLP have served as the Alternative Investment Fund Manager since 15 March 2019; references in this statement to "AIFM" are to Impact Health Partners LLP.
Quantitative remuneration disclosure for the AIFM
Information in relation to the remuneration paid by the AIFM is available upon request.
Liquidity
At the date of this annual report there are no assets held by the Company which are subject to special arrangements arising from their illiquid nature. There has been no change to the liquidity management system and procedures during the period since incorporation. Please refer to note 20 in the financial statements for an analysis of the Company's liabilities and their maturity dates at 31 December 2024.
The current risk profile of the Company and the risk management systems employed by the AIFM to manage those risks
The Company's risk management framework and risk appetite are set out in "Audit, risk and internal control" on pages 125 to 127 of the 2024 annual report.
Please refer to page 37 and 38 of the 2024 annual report for the board's assessment of the principal risks and uncertainties facing the Company. The AIFM has assessed the current risk profile of the Company to be low.
Leverage
The Group's maximum and actual leverage levels at 31 December 2024 are shown below:
| Leverage exposure method | Gross method | Commitment |
| Maximum limit | 200.0% | 200.0% |
| Actual | 147.8% | 149.9% |
For the purposes of (i) the EU Alternative Investment Fund Managers Directive (Directive 2011/61/EU) (the 'EU AIFMD'); and (ii) the UK version of EU AIFMD as it forms part of UK law by virtue of the European Union (Withdrawal) Act 2018, and as implemented by the Financial Conduct Authority in the UK (the 'UK AIFMD'), leverage is any method that increases the Group's exposure, including the borrowing of cash and the use of derivatives. It is expressed as a percentage of the Group's exposure to its net asset value and is calculated on both a gross and commitment method.
Under the gross method, exposure represents the sum of the Group's positions after deduction of cash balances, without taking account of any hedging or netting arrangements. Under the commitment method, exposure is calculated without the deduction of cash balances and after certain hedging and netting positions are offset against each other. Both methods include the Group's interest rate swaps measured at notional value.
There has been no change to the maximum level of leverage that the AIFM may employ on behalf of the Company. The Company's investment policy has a maximum gross leverage ratio of 35% at the time of drawdown and the AIFM is required under the IMA to comply with this limit. The actual level of gearing employed by the Company at 31 December 2024 was 28.33%.
Material changes to information
Article 23 of the EU AIFMD (in respect of the marketing of the Company in the EU) and FUND 3.2.2, 3.2.5 and 3.2.6 of the UK AIFMD (in respect of the marketing of the Company in the UK) require certain information to be made available to investors before they invest (the 'Required Information') and require material changes to the Required Information to be disclosed to investors. An updated copy of the Company's disclosure schedule containing the Required Information was published on 27 January 2023. There have been no other material changes to the Required Information.
Investment policy
The Company's investment policy is to acquire, own, lease, renovate, extend and redevelop high-quality healthcare real estate assets in the UK, in particular elderly care homes, and to lease those assets to care home operators and other healthcare service providers under full repairing and insuring leases.
The Company pursues the investment policy as follows:
| Policy | Status |
| In order to manage risk in the portfolio, at the time of investment, no single asset shall exceed in value 15% of the total gross asset value of the Group.
|
|
| No single customer paying for care provided in assets owned by the Group will account for more than 15% of the aggregate revenues of the tenants to whom the Group's assets are leased from time to time, measured at the time of acquisition.
|
|
| The annual contracted rent from any single tenant is not expected to exceed 40% of the total annual contracted rent of the Group, measured at the time of investment.
|
|
| The portfolio will be diversified by location across the UK with focus on areas where there is a good balance of supply and demand for the provision of care and assets are available at attractive valuations.
|
|
| Within these locations, the Group will acquire existing modern buildings or those that are currently considered fit for purpose by occupiers, but in respect of which the Investment Manager has developed a plan to add value to, and improve the environmental sustainability of, the asset through targeted capital expenditure.
|
|
| Leases granted by the Group will be linked to inflation, have long duration (with an unexpired lease term of at least 20 years) and will not be subject to break clauses. The Group will seek to amend any future leases acquired by the Group to obtain similar terms.
|
|
| The Group will not undertake speculative development (that is, development of property which has not been leased or preleased), subject to the limitation in the final bullet below, so as to reposition a home in its local market and thus to increase the rent due.
|
|
| The Group may invest in forward-funding agreements or forward commitments to pre-let developments, or as part of a structured acquisition of an asset, subject to the limitation in the final bullet below, where the Group will own the asset on the completion of the work, or has the ability to acquire the asset upon agreed conditions being satisfied.
|
|
| The gross budgeted development costs of any refurbishment, extension or replacement of existing holdings and/or forward funding and forward commitments, is limited to 25% of the Company's gross assets at the time of commitment. |
|


The Group is permitted to generate up to 15% of its gross income in any financial year from non‑rental revenue or profit-related payments from the tenants in addition to the rental income due under the leases. The Group is also permitted to invest up to:
(i) 10% of its gross assets, at the time of investment, in non-residential healthcare real estate assets, such as properties which accommodate GP or dental practices and other healthcare-related services including occupational health and physiotherapy practices, pharmacies and hospitals or in non-healthcare-related residential assets attached to residential healthcare real estate assets;
(ii) 25% of its gross assets, at the time of investment, in indirect property investment funds (including joint ventures) with a similar investment policy to that of the Company; and
(iii) 15% of its gross assets, at the time of investment, in other closed-ended investment funds listed on the Official List. The directors have no current intention to acquire non-residential healthcare real estate assets or indirect property investment funds.
The Group may also acquire or establish companies, funds or other SPVs which themselves own assets falling within the Company's investment policy.
The Group will not acquire any asset or enter into any lease or related agreement if that would:
(i) result in a breach of the conditions applying to the Company to hold real estate investment trust (REIT) status; or
(ii) result in any investment by the Group in assets located outside of the UK.
The Company may invest cash held for working capital purposes and awaiting investment in cash deposits, gilts and money market funds. It will not invest in derivatives but it may use derivatives for hedging purposes.
The Group is permitted to borrow up to a maximum of 35% of the gross asset value of the Group as a whole, calculated at the time of drawdown.
Any material change to the investment policy will require the prior approval of shareholders.
How we manage risk
Overview
The directors are responsible for maintaining our system of internal control and risk management, in order to safeguard our assets. This system is designed to identify, manage and mitigate the financial, operational and compliance risks we face, and to manage rather than eliminate the risk of failing to achieve our business objectives.
Risk profile
Our principal risks and uncertainties are set out on pages 37 to 38 of the 2024 annual report. The directors have performed robust reviews of our principal and emerging risks during the year, with the Investment Manager's support. We also consider our principal risks in the context of the UK AIFMD, which sets out certain categories of risk that the Investment Manager must take into account, in monitoring and managing risk on our behalf.
The risk register details our principal risks and our mitigations to control them. It measures each risk's inherent likelihood and impact, and the residual likelihood and impact assuming our controls operate effectively. The board updates and approves the risk register at least annually.
The board has procedures in place to ensure that we monitor and manage risks on an ongoing basis and that it receives adequate assurance that our systems and controls are operating effectively.
Risk appetite
Our risk appetite reflects the risks the board is willing to take to achieve our investment objectives, as set out on page 3 of the 2024 annual report. We continued to review and update our risk appetite framework during the year, as well as assessing our current and past compliance with our risk appetite.
Risk processes
Our risk governance structure is summarised on page 127 of the 2024 annual report:
Board
· Has ultimate responsibility for our risk management and internal control.
· Delegates certain responsibilities to the audit and management engagement committees.
· Reviews the Company's liquidity each quarter.
· Assesses our principal emerging risks twice a year.
· Assesses and articulates our risk appetite.
Audit committee
· Keeps our internal financial controls and internal control and risk management systems under review. Receives reports from the risk committee, and from service providers, and reports exceptions to the board and follows up queries with the risk committee.
· Reviews the effectiveness of the risk management framework each year.
· Reviews and approves the statements to be included in the annual report concerning internal controls and risk management.
· Reviews and approves statements explaining how assets have been invested, with a view to spreading investment risk.
Management engagement committee
· Considers risk issues arising from the functions performed by service providers and reported to the management engagement committee or board as necessary.
Investment Manager
· Performs portfolio and risk management functions, including monitoring the systems and controls for managing risk.
· Oversees operational risks and reviews principal risks.
· Forecasts cash flows and monitors compliance with debt covenants.
· Monitors our compliance with the qualifying conditions set out in the UK REIT rules (Corporation Tax Act 2010).
· Has appointed Carne Global AIFM Solutions (C.I.) Limited to carry out risk management on its behalf.
Risk committee of the Investment Manager
· Identifies key and emerging risks and the controls to mitigate those risks (documented in the risk register).
· Assesses the materiality of each risk, according to its likelihood and potential impact (documented in the risk register).
· Assesses control effectiveness each quarter, via reporting on key risks by the Investment Manager, Administrator, registrar and Depositary.
· Agrees actions for risks that are outside our tolerance, ensures that risk events, errors and breaches are appropriately remedied, and that controls are enhanced to prevent reoccurrence.
· Reviews risks to our business model, future performance, solvency or liquidity, in the context of the going concern and long-term viability statements.
· Reviews counterparty credit risk, with reference to our financing arrangements and policies.
· Reviews regulatory risk via the Administrator's compliance monitoring and the Investment Manager's monitoring of the REIT conditions.
· Assesses service provider risk via Service Organisation Control reports and due diligence reviews.
· Reports key matters to the audit committee.
Company Secretary and Administrator
· Monitors compliance with the UK Listing Rules and the Disclosure Guidance and Transparency Rules.
· Prepares quarterly management accounts.
Depositary
· Reviews risks relevant to the depositary function in accordance with the requirements of UK AIFMD.
· Includes verification of assets, payment of expenses, leverage limits, investment restrictions, cash flow monitoring and good title to assets.
Service providers
· Responsible for monitoring their own internal control systems, to ensure they properly manage risk when performing services for us.
Internal control processes
The audit committee, working with the Investment Manager and Administrator, reviews the Group's systems of risk management and their effectiveness, on behalf of the board. These systems and processes were in place for the year under review and remained in place up to the date of approval of the annual report and accounts.
Our internal control systems include a detailed authorisation process, formal documentation of all transactions, a robust system of financial planning (including cash flow forecasting and scenario testing) and a robust appraisal process for all property investments, including compliance with our conflicts policy.
In addition, the board has a Financial Position & Prospects Procedures board memorandum, which the audit committee reviews annually and updates when required. This sets out our procedures for identifying the information needed to monitor the business and manage risk, so we can make proper judgements on our financial position and prospects. It also details our procedures to identify, assess and document the risk factors likely to affect our financial position and prospects and any changes, and the preparation and communication to the directors of related information. This was last reviewed at the audit committee meeting in November 2023.
The risk committee of the Investment Manager addresses changes to our internal controls, or controls to respond to changing risks, and escalates to the audit committee or board as required.
The directors, along with the Investment Manager and Administrator, have established an internal control framework to provide reasonable assurance on the effectiveness of our internal controls. This covers capital expenditure approval and authorisation of capital funding, investment acquisition and disposal approval, annual budget approval, expenditure and supplier contract approval, NAV and dividend authorisation, equity and debt approval, and formal communications with investors.
During the year, the directors received a report from the Investment Manager that summarises its internal controls and confirms that the controls are operating effectively. The directors have also received bridging letters from service providers to provide assurance that their controls continued to operate effectively throughout the period under review, where the service providers' own review of their internal controls is not coterminous with our reporting period.
Financial reporting
We have internal control and risk management arrangements relating to our financial reporting processes and preparing our consolidated accounts, with the Investment Manager and Administrator's support. We have established and documented our internal management reporting and external statutory reporting timetables and delivery requirements. The Administrator controls these and communicates them regularly.
The arrangements include the Administrator's procedures to maintain records that accurately and fairly reflect transactions. The Investment Manager reviews and comments on the records, to confirm the appropriate treatment.
Where we are adopting new reporting standards or financial reporting approaches, due to either changing regulation or new contractual arrangements, the Administrator, in collaboration with the Investment Manager, prepares an assessment of this treatment and discusses it with the audit committee. Where required, third-party advisers are consulted. This enables us to prepare financial statements in accordance with UK-adopted International Financial Reporting Standards (IFRS), or FRS 102, as appropriate, with reasonable assurance. Reported data is reviewed and reconciled by the Administrator, in collaboration with the Investment Manager, with appropriate monitoring internally and by the audit committee.
We monitor our ongoing financial performance through the Administrator reporting regularly to the Investment Manager, with performance then reported to the board.
We regulate our capital investment and all revenue expenditure through our budget process and authorisation levels. The Investment Manager prepares a budget which the board approves annually, and the board receives quarterly reports of performance against budget. The Administrator also tracks expenditure and investment against budget. Payment of Investment Manager fees are presented to an individual director for sign off.
RNS may use your IP address to confirm compliance with the terms and conditions, to analyse how you engage with the information contained in this communication, and to share such analysis on an anonymised basis with others as part of our commercial services. For further information about how RNS and the London Stock Exchange use the personal data you provide us, please see our Privacy Policy.